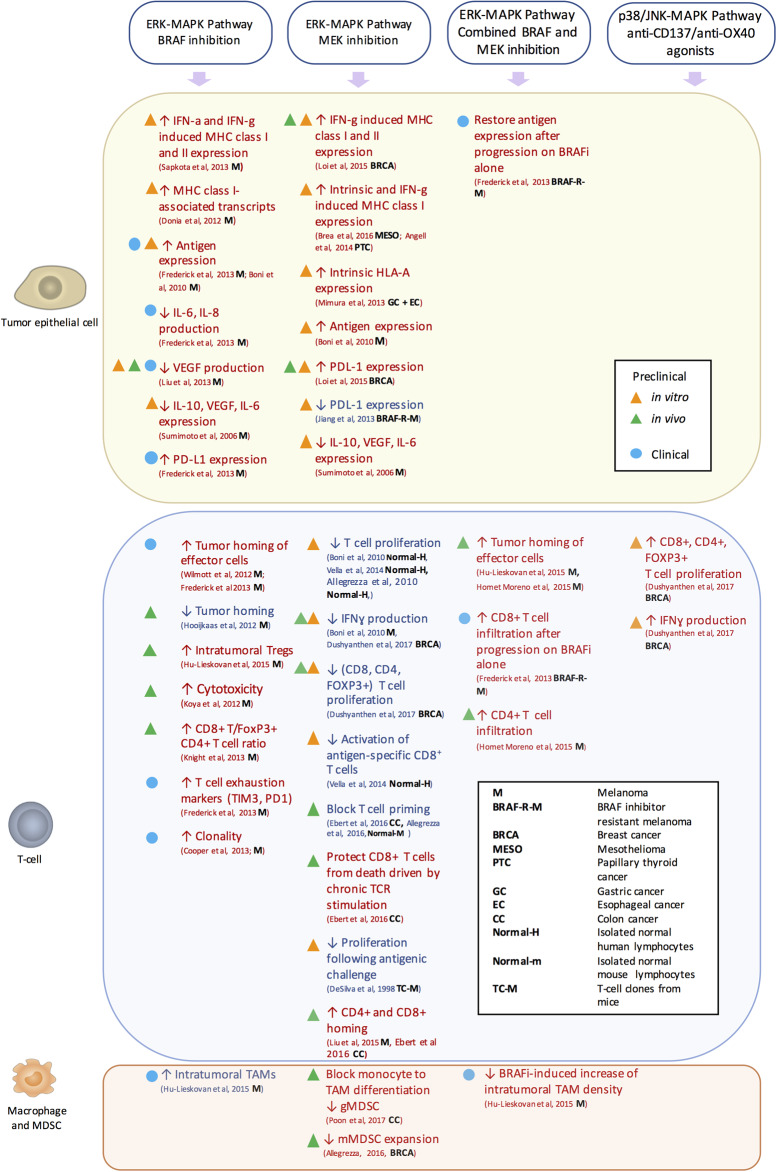
Figure 3. Immunologic impact of MAPK-targeted interventions per cell population.
The immunologic effects of MAPK-pathway interventions are represented. Preclinical in vitro (orange triangle), in vivo (green triangle), and clinical (blue circle) evidence of the direct and indirect effects of these interventions are summarized per cell population that comprises the tumor microenvironment. The investigated tumor type is indicated for each of these studies by abbreviation (bold) as defined in the figure. Effects that favor or counteract tumor rejection are showed in red and blue, respectively.

