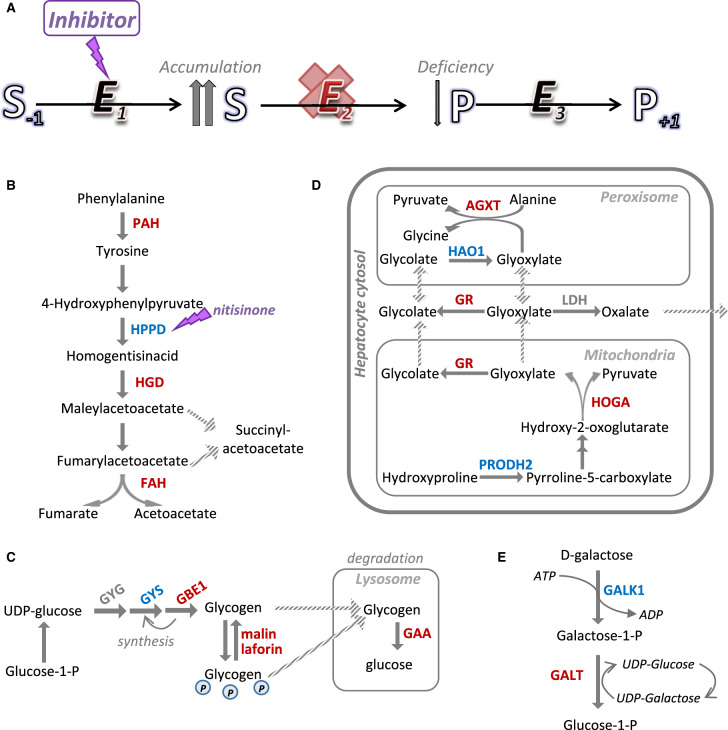
Figure 1. SRT examples applied to linear pathways of metabolite interconversion.
(A) Schematic diagram illustrating the general concept of SRT, where E2 is the defective enzyme, and E1 is the inhibitory target for SRT. (B) Pathway of tyrosine degradation. (C) Pathway of glycogen biosynthesis and targeted degradation in lysosome. (D) Pathway of glyoxylate metabolism in hepatocytes. (E) Pathway of galactose metabolism. For (B–E), blue letters denote enzymes targeted by SRT, red letters denote the defective enzymes.

