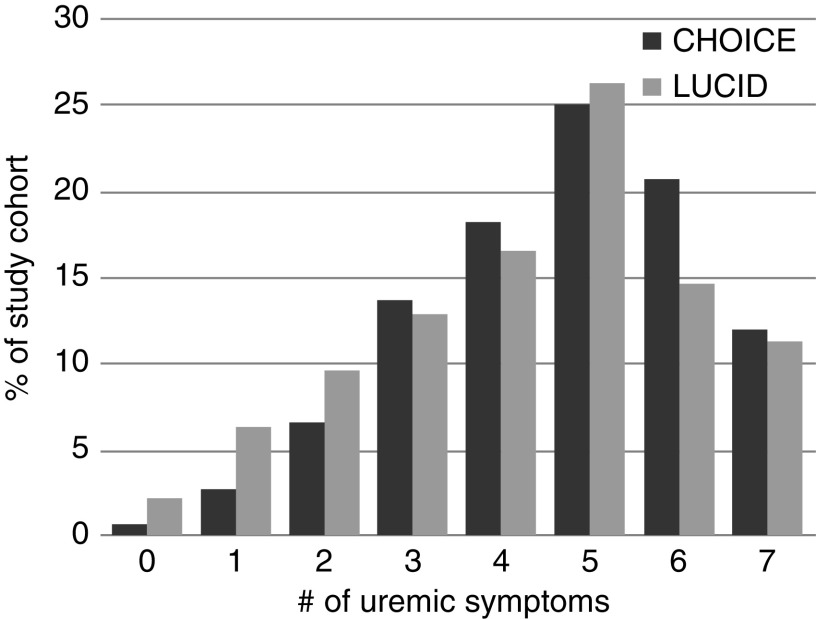
Figure 1.
Many individuals in CHOICE and LUCID have multiple uremic symptoms. The y axis shows the percentage of each study cohort (N=926 in CHOICE and N=428 in LUCID) with the corresponding number (#) of uremic symptoms shown on the x axis. CHOICE, Choices for Health Outcomes in Caring for ESRD; LUCID, Longitudinal United States/Canada Incident Dialysis.

