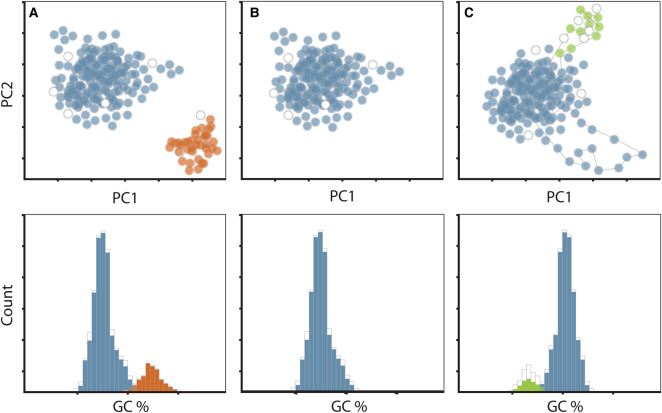
Figure 2. Tetranucleotide principle component analysis (top) and GC content analysis (bottom) of target SAGs (blue) alongside additional contaminating sequence (red) and integrated phage sequences (green).
Target SAG containing contamination (A); target SAG where contamination was removed (B); target SAG with an outlying rRNA gene and an integrated phage (C). (C) Chromosomal elements such as the highly conserved rRNA genes (blue outlying points) often have tetranucleotide frequencies that differ from the main genome. Integrated phage genes can also appear as outlying points with distinct nucleotide composition and unique taxonomy (green outlying points). Each point in the plot represents fragments of contigs that split into 5000 bp fragments. Colored points (top panel) and bars (bottom panel) represent contigs that can be taxonomically classified, whereas white points or bars represent contigs with no taxonomic assignment.

