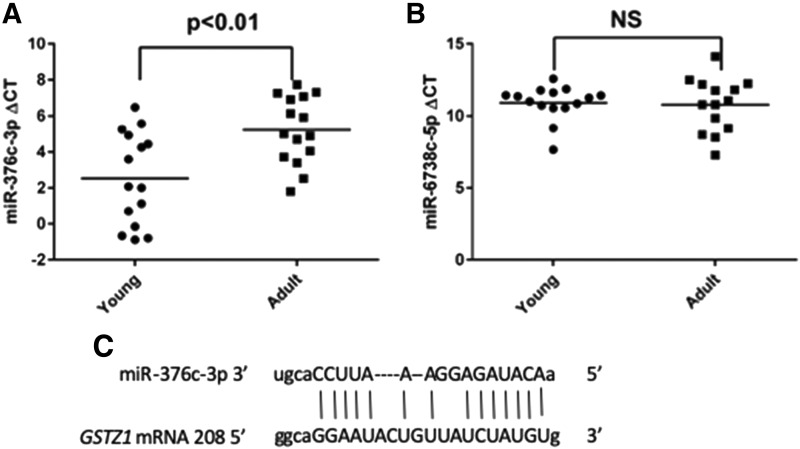
Fig. 3.
qPCR confirmation of array results for miR-376c-5p (A) and miR-6738-5p (B). Total RNA from young and adult livers was analyzed with RT-qPCR to identify expression levels of the indicated miRNA. Statistical differences were determined by Student’s t test, n = 15 in each group. (C) illustration of the binding of miR-376c-3p to the mRNA of GSTZ1.

