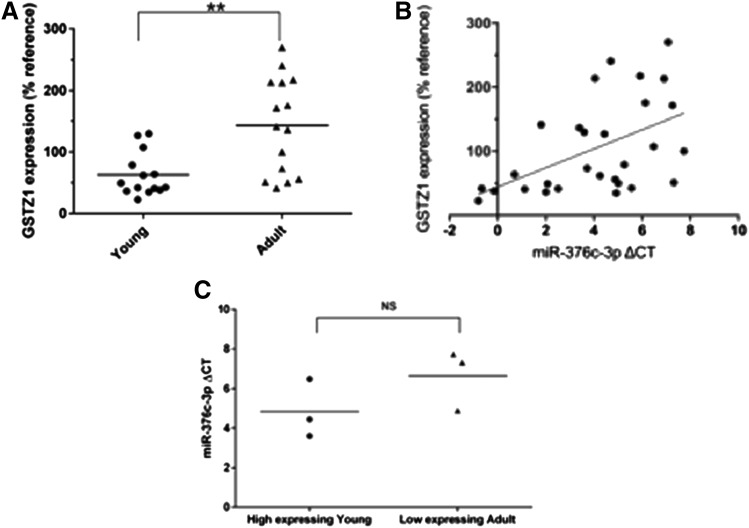
Fig. 4.
Correlation of GSTZ1 protein expression with miR-376c-3p. (A) Relative expression of GSTZ1 protein, as determined by densitometry of Western blots, in livers from young and adult populations. Protein levels are expressed as a percentage compared with a single sample that was used as a reference on all blots. ** indicates a significant difference between groups, P < 0.01 as determined by Student’s t test, n = 14 in young and n = 15 in adult. (B) Scatterplot showing a direct correlation between GSTZ1 protein expression and miR-376c-3p ΔCt (and therefore an inverse correlation with miR-376c-3p expression). Each point represents one liver sample. (C) Comparison of miR-376-3p ΔCt values from the three young samples with the highest expression of GSTZ1 and three low-expressing adults revealed no difference.

