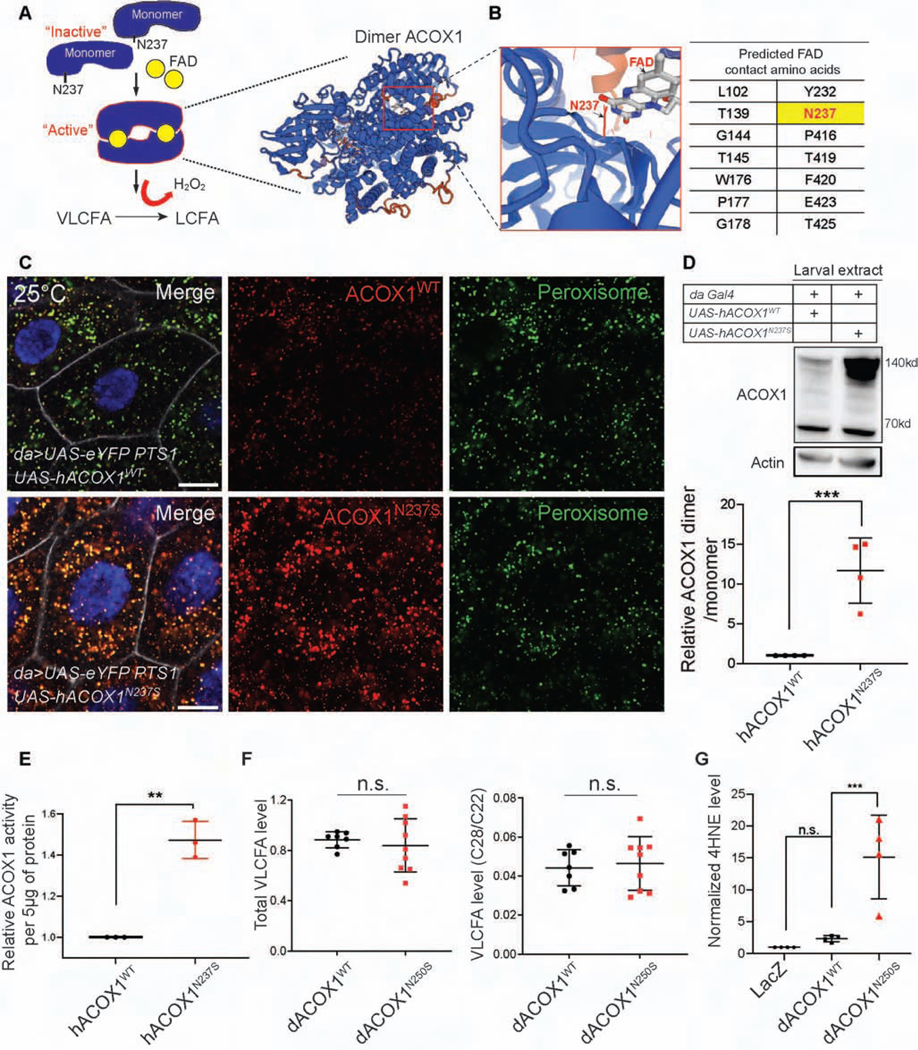
Figure 4. hACOX1N237S promotes dimer formation and elevated ACOX1 protein levels.
(A) The current model for hACOX1 dimerization (left) and the 3D protein structure of a hACOX1 dimer bound to 2 flavine adenine dinucleotides (FAD) (right). (B) Enlarged view of a portion of the FAD contact region of hACOX1. The black arrow points to asparagine 237, and N237 is part of the FAD binding pocket of hACOX1. (C) hACOX1N237S protein accumulates in vivo when compared to hACOX1WT. Scale bar: 10μm. (D) hACOX1N237S accumulates in the form of dimers. hACOX1 protein levels are elevated in larval extracts in which N237S is expressed. Quantification of relative dimer/monomer ACOX1 level from the blot of (D). n = 4 independent blots, Mean ± s.e.m. ***p< 0.001, Statistical analyses were determined by 2-sided Student’s t-test. (E) Purified hACOX1N237S protein show higher activity than hACOX1WT when normalized for protein level. (n = 3 for each), Mean ± s.e.m. **p< 0.01, Statistical analyses were determined by 2-sided Student’s t-test. (F) Gas chromatography mass spectrometry for total VLCFA, and the relative level of VLCFA (C28:0/C22:0). n = 7 (da>dACOX1WT, 10 adult flies extracts). n = 9 (da>dACOX1N250S), Statistical analyses were determined by 2-sided Student’s t-test. n.s., not significant. (G) Quantification of relative 4HNE (STAR Methods) level normalized by actin, n = 4 independent blots (50 larvae per each blot), Statistical analyses are one-way ANOVA followed by a Tukey post-hoc test. Mean ± s.e.m. ***p < 0.001, n.s., not significant.

