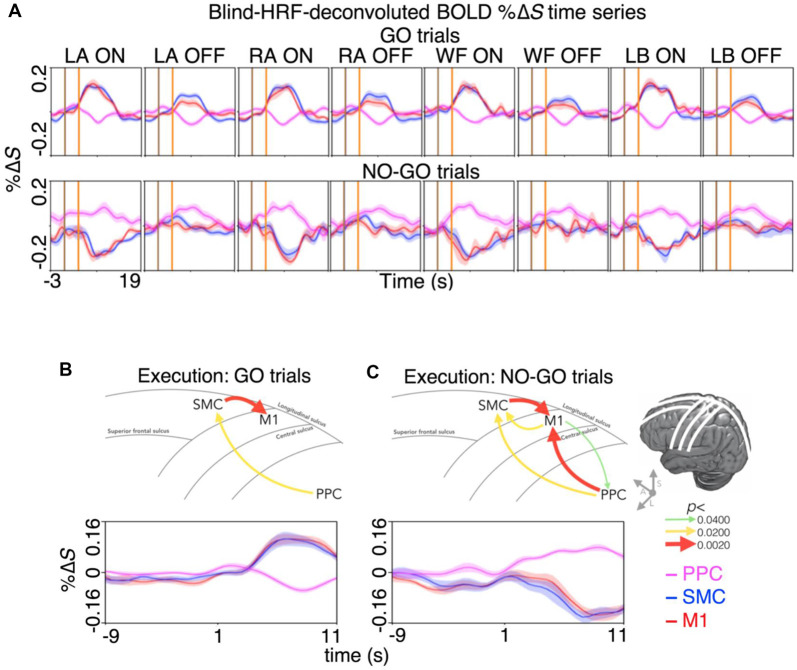
Figure 4.
Spatiotemporal dynamics of BOLD activity and directional information flow across the dorsal motor network during motor inhibition and motor restraint. (A) The condition and region-specific trial-averaged BOLD %ΔS time-courses during motor inhibition (top row) and motor restraint (bottom row). During motor inhibition, BOLD activity peaked at the same time in the M1 and the SMC. During motor restraint, BOLD activity in the SMC and the M1 troughed at the same time as BOLD activity peaked in the PPC. The pattern of recurrent information flow across the dorsal motor network differed during (B) motor inhibition and (C) motor restraint. Averaging across the significant voxels and trials revealed a G-causal relationship from the SMC to the M1 during motor inhibition. During motor restraint, G-causal relationships were revealed from the PPC to the SMC and the M1. The line drawing and the arrows depict the major sulci of the brain and the direction of G-causal relationships. The curves plot the voxel, trial and participant averaged %ΔS of each region.

