FIG. 3.

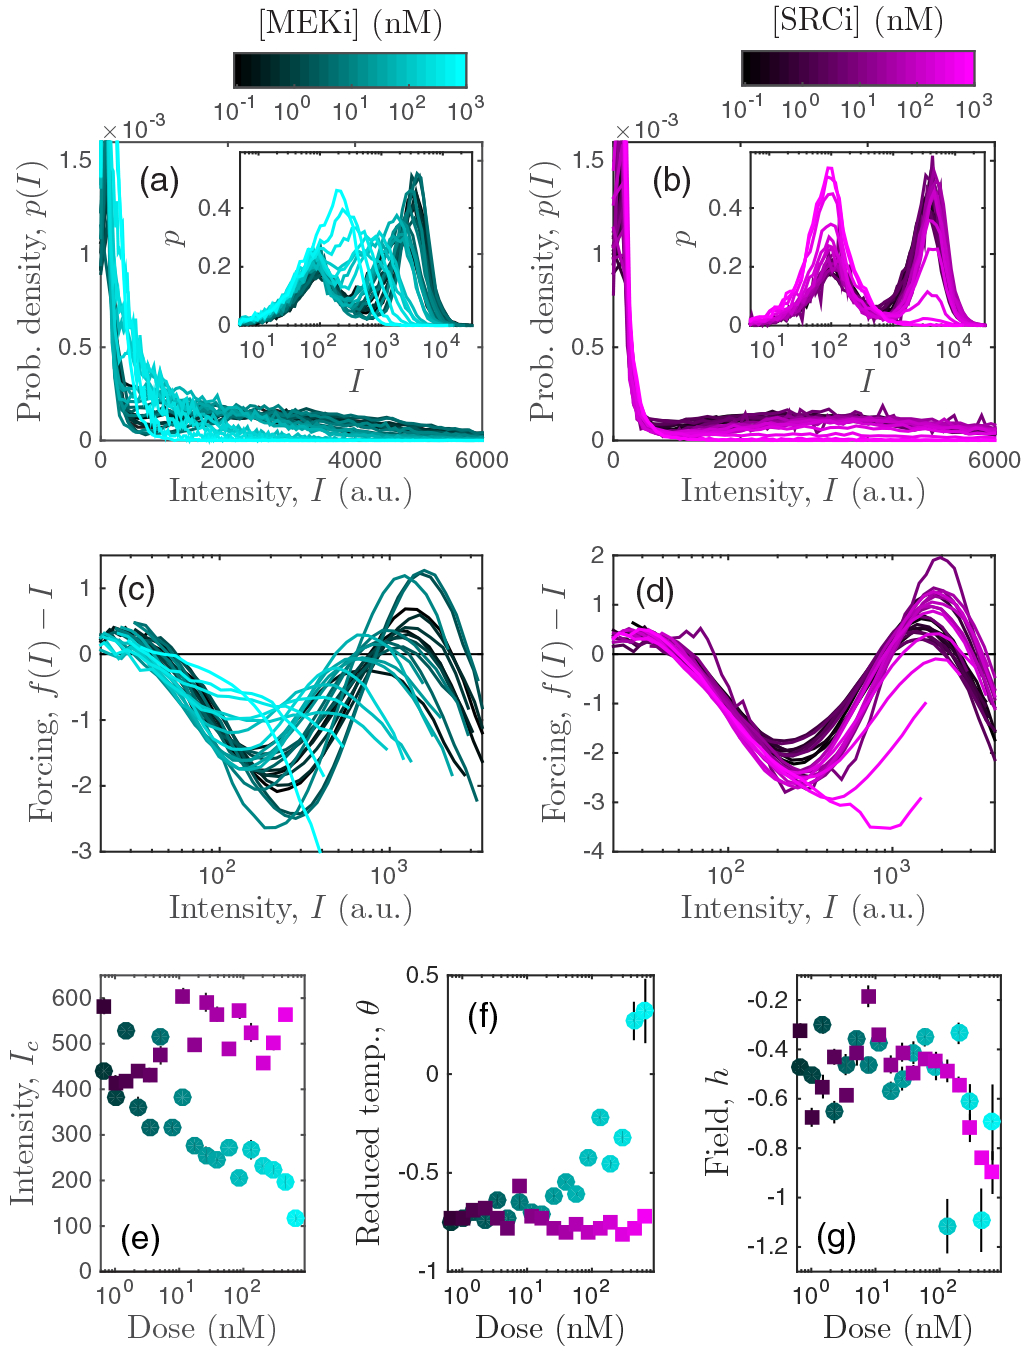
Application of the theory to immune cell data. Upon administration of either (a) MEK or (b) SRC inhibitor, experimental distributions of T cell ppERK fluorescence intensity are unimodal (bimodal) for high (low) doses. Insets show distributions of log intensity for clarity. (c),(d) Feedback functions calculated from the experimental distributions correspondingly exhibit either one or two stable states. (e)–(g) Effective thermodynamic quantities calculated from the data vary with drug dose in distinct ways for each drug. The results in (c)–(g) corroborate those in [4], but with a much simpler framework that has three parameters instead of five and requires no fitting or prior biological knowledge of the system. Error bars: standard error from filter windows 25 ⩽ W ⩽ 35 (see Appendix D).
