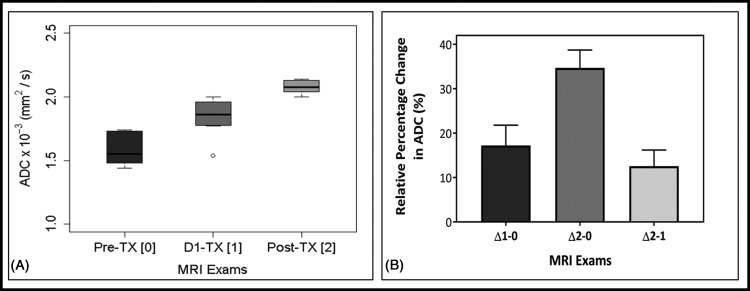
Figure 2.
Box and whisker plot comparing mean apparent diffusion coefficient (ADC) values obtained from patients with pancreatic ductal adenocarcinoma (PDAC) at the longitudinal magnetic resonance examinations: pre-treatment (TX[0]), after the first fraction of stereotactic body radiotherapy, D1-TX[1], and post-TX[2]. ADC value showed a significant difference between these MRI examinations (P < .05). Boxes represent the interquartile range, whiskers represent the range of all values, and the horizontal line within the box is the median value. Open circles represent the outliers (A). Bar plots exhibit the longitudinal relative percentage changes in ADC values, and rΔADC (%) showed significant differences between MRI examinations (P < .05). Error bars indicate the standard error of the mean (B).

