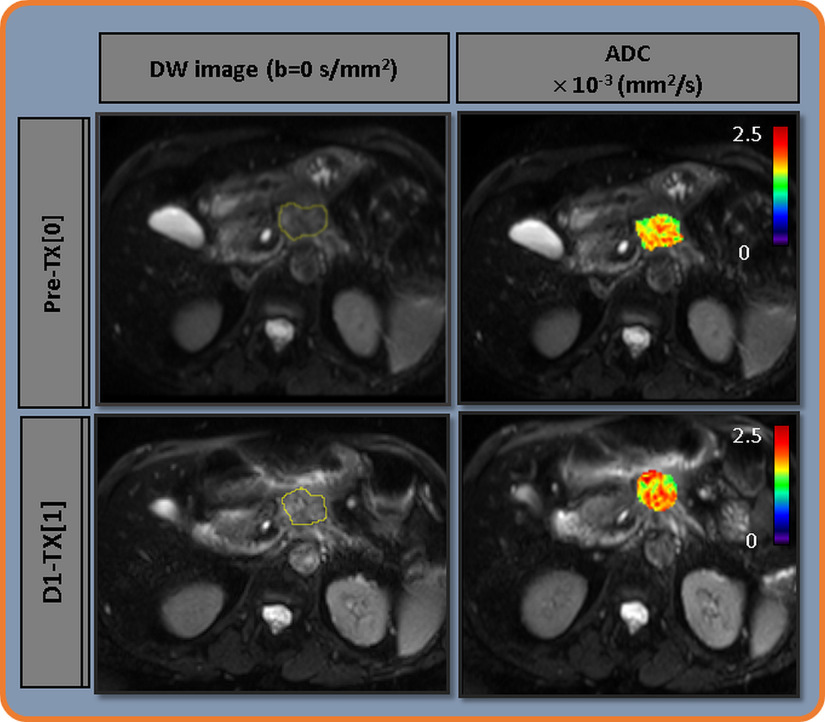
Figure 3.
Left: Representative diffusion-weighted (DW) images (b = 0 [s/mm2]) obtained from a patient with PDAC who showed a local control (61 years, female) at pre-treatment (TX[0]) and immediately after the first fraction of stereotactic body radiotherapy, D1-TX[1]. Regions of interest are outlined in yellow. Right: ADC maps overlaid on DW image (b = 0 [s/mm2]) at pre-TX[0] and D1-TX[1]. An increase in ADC value at post-TX[2] is evident.

