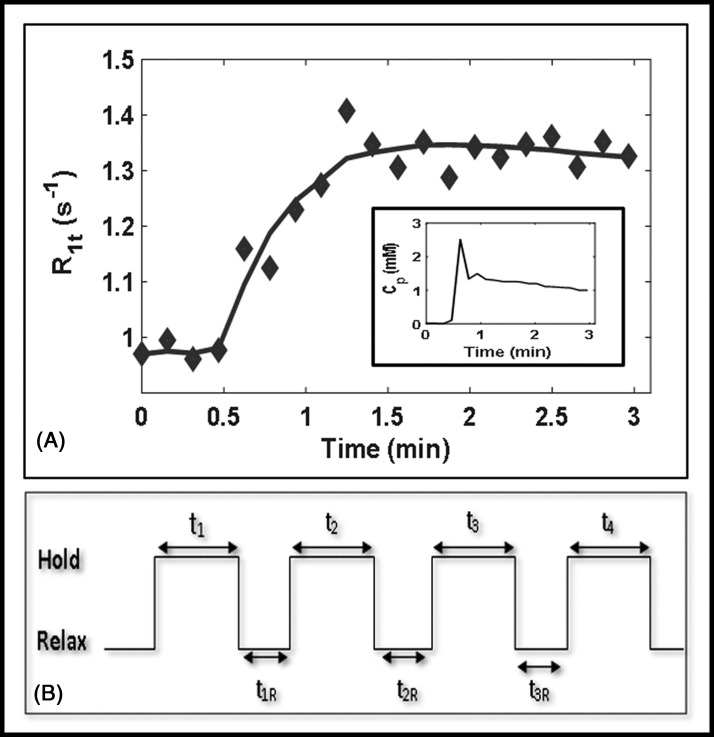
Figure 4.
Plot of the representative longitudinal relaxation rate, R1t(t), time-course data obtained from 1 enhancing pixel fitted with the shutter-speed model. Regions of interest are outlined in yellow at pre-TX[0] and immediately after the first fraction of stereotactic body radiotherapy, D1-TX[1]. Inset: The plasma contrast agent concentration, Cp, data plot extracted from the aorta, which is outlined in the red circle at D1-TX[1] (A). Representative dynamic contrast-enhanced data acquisition schema (B).

