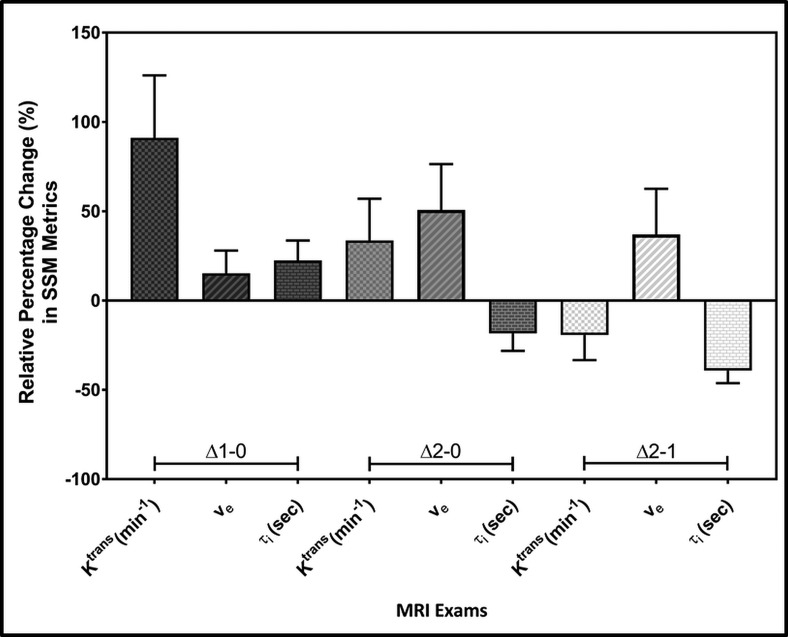
Figure 6.
Bar plots display the relative percentage changes in mean Ktrans (min−1), ve, and τi (seconds) values between longitudinal MR examinations (ie, pre-treatment (TX[0]), immediately after the first fraction of stereotactic body radiotherapy D1-TX[1], and post-TX[2]). rKtransΔ2-0 versus rKtransΔ1-0, rveΔ2-1 versus rveΔ2-0, rveΔ2-1 versus rveΔ2-0, and rτiΔ2-1 versus rτi2-0 exhibited significant differences (P < .05). Error bars indicate the standard error of the mean.

