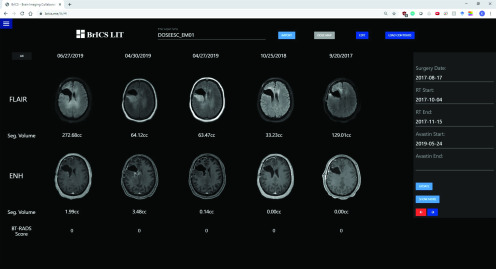
Figure 1.
An example patient with glioblastoma (GBM) enrolled in our dose escalation trial at Emory site. Follow-up images are displayed from the earliest date on the far right (pre-RT) to the most recent date on the left. T2 FLAIR (top row) images and contrast-enhanced T1-weighted (CE-T1w) magnetic resonance imaging (MRI) images (bottom row) are co-registered and interpolated to allow for simultaneous scrolling through all slices.

