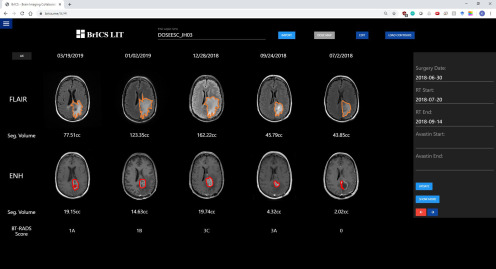
Figure 5.
An example Johns Hopkins patient with GBM with follow-up imaging co-registered and ready to view in BrICS-LIT. Contours have been generated semiautomatically, with respective volumes of lesion calculated. A neuroradiologist used the segmented volumes, along with REDCap data on the right panel to assign BT-RADS scores for each visit date.

