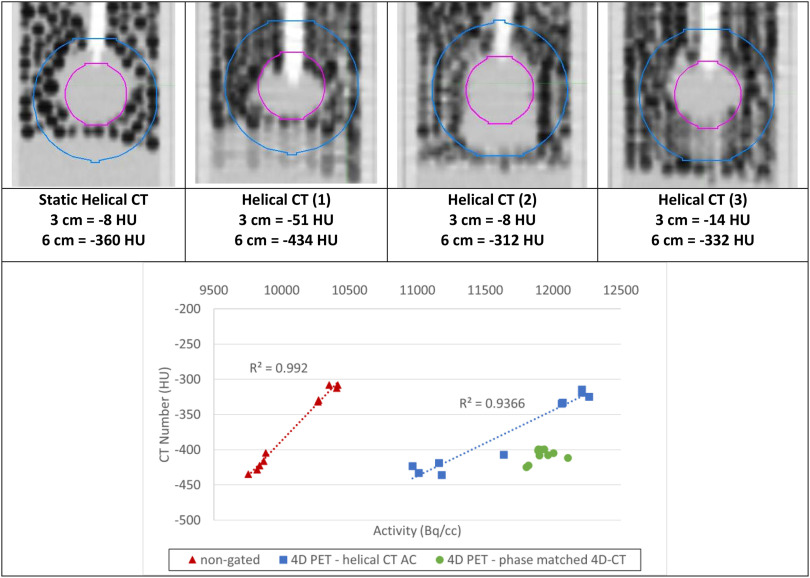
Figure 6.
Depending on where the helical CT (hCT) catches the sphere in the breathing pattern (top), there is a clear correlation (R2 = 0.99 for nongated, R2 = 0.94 for helical gated) between mean sphere radioactivity (kBq) and CT number (HU) (bottom) for the 10 different hCTs used to generate the nongated and gated hCT-AC-based PET acquisitions. The 4D-CT numbers remain clustered and produce similarly clustered pet activity values.

