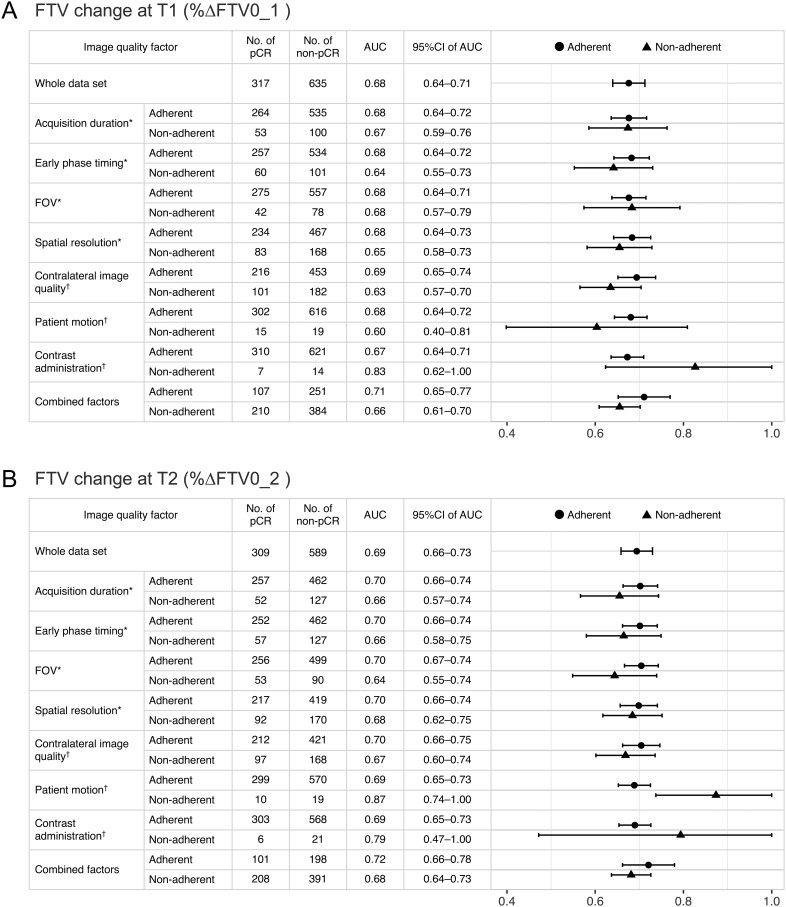
Figure 3.
Predictive performance of pCR and image quality factors. Area under the receiver operating characteristic curves (AUCs) and associated 95% confidence intervals (CI) for adherent and non-adherent functional tumor volume (FTV) change subsets at (A) T1 and (B) T2 are shown. Data for the whole data set are shown in the top followed by data for subsets for each image quality factor (DICOM-confirmable factors*, not DICOM-confirmable factors†, and combined factors). In the plot column, dots, or triangles show the estimated AUCs, and bars show the range of 95% CIs for adherent and non-adherent subsets.

