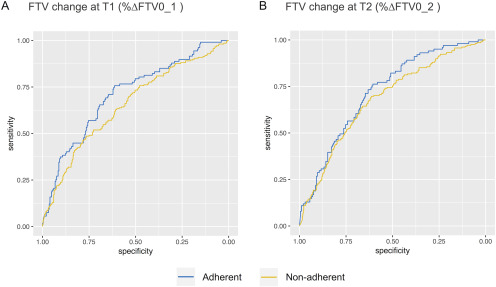
Figure 4.
Receiver operating characteristic curves of adherent or non-adherent FTV change subsets at (A) T1 and (B) T2 in combined factors. FTV change with adherent image quality in combined factors had higher AUC value than that with nonadherent image quality (T1, 0.71 vs 0.66; T2, 0.72 vs 0.68), although the differences did not reach statistical significance.

