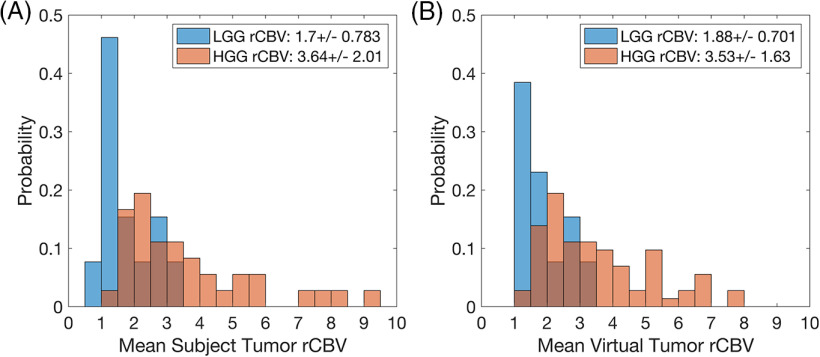
Figure 2.
Histogram distributions of mean relative cerebral blood volume (rCBV) the for The Cancer Imaging Archive (TCIA) data set (A) and the virtual tumors (B) for tumor grade: low-grade glioma (LGG) (blue) and high-grade glioma (HGG) (red). The rCBV distributions for both populations are similar (as listed within the legend), with slight deviations noted for very low and high mean rCBV tumors.

