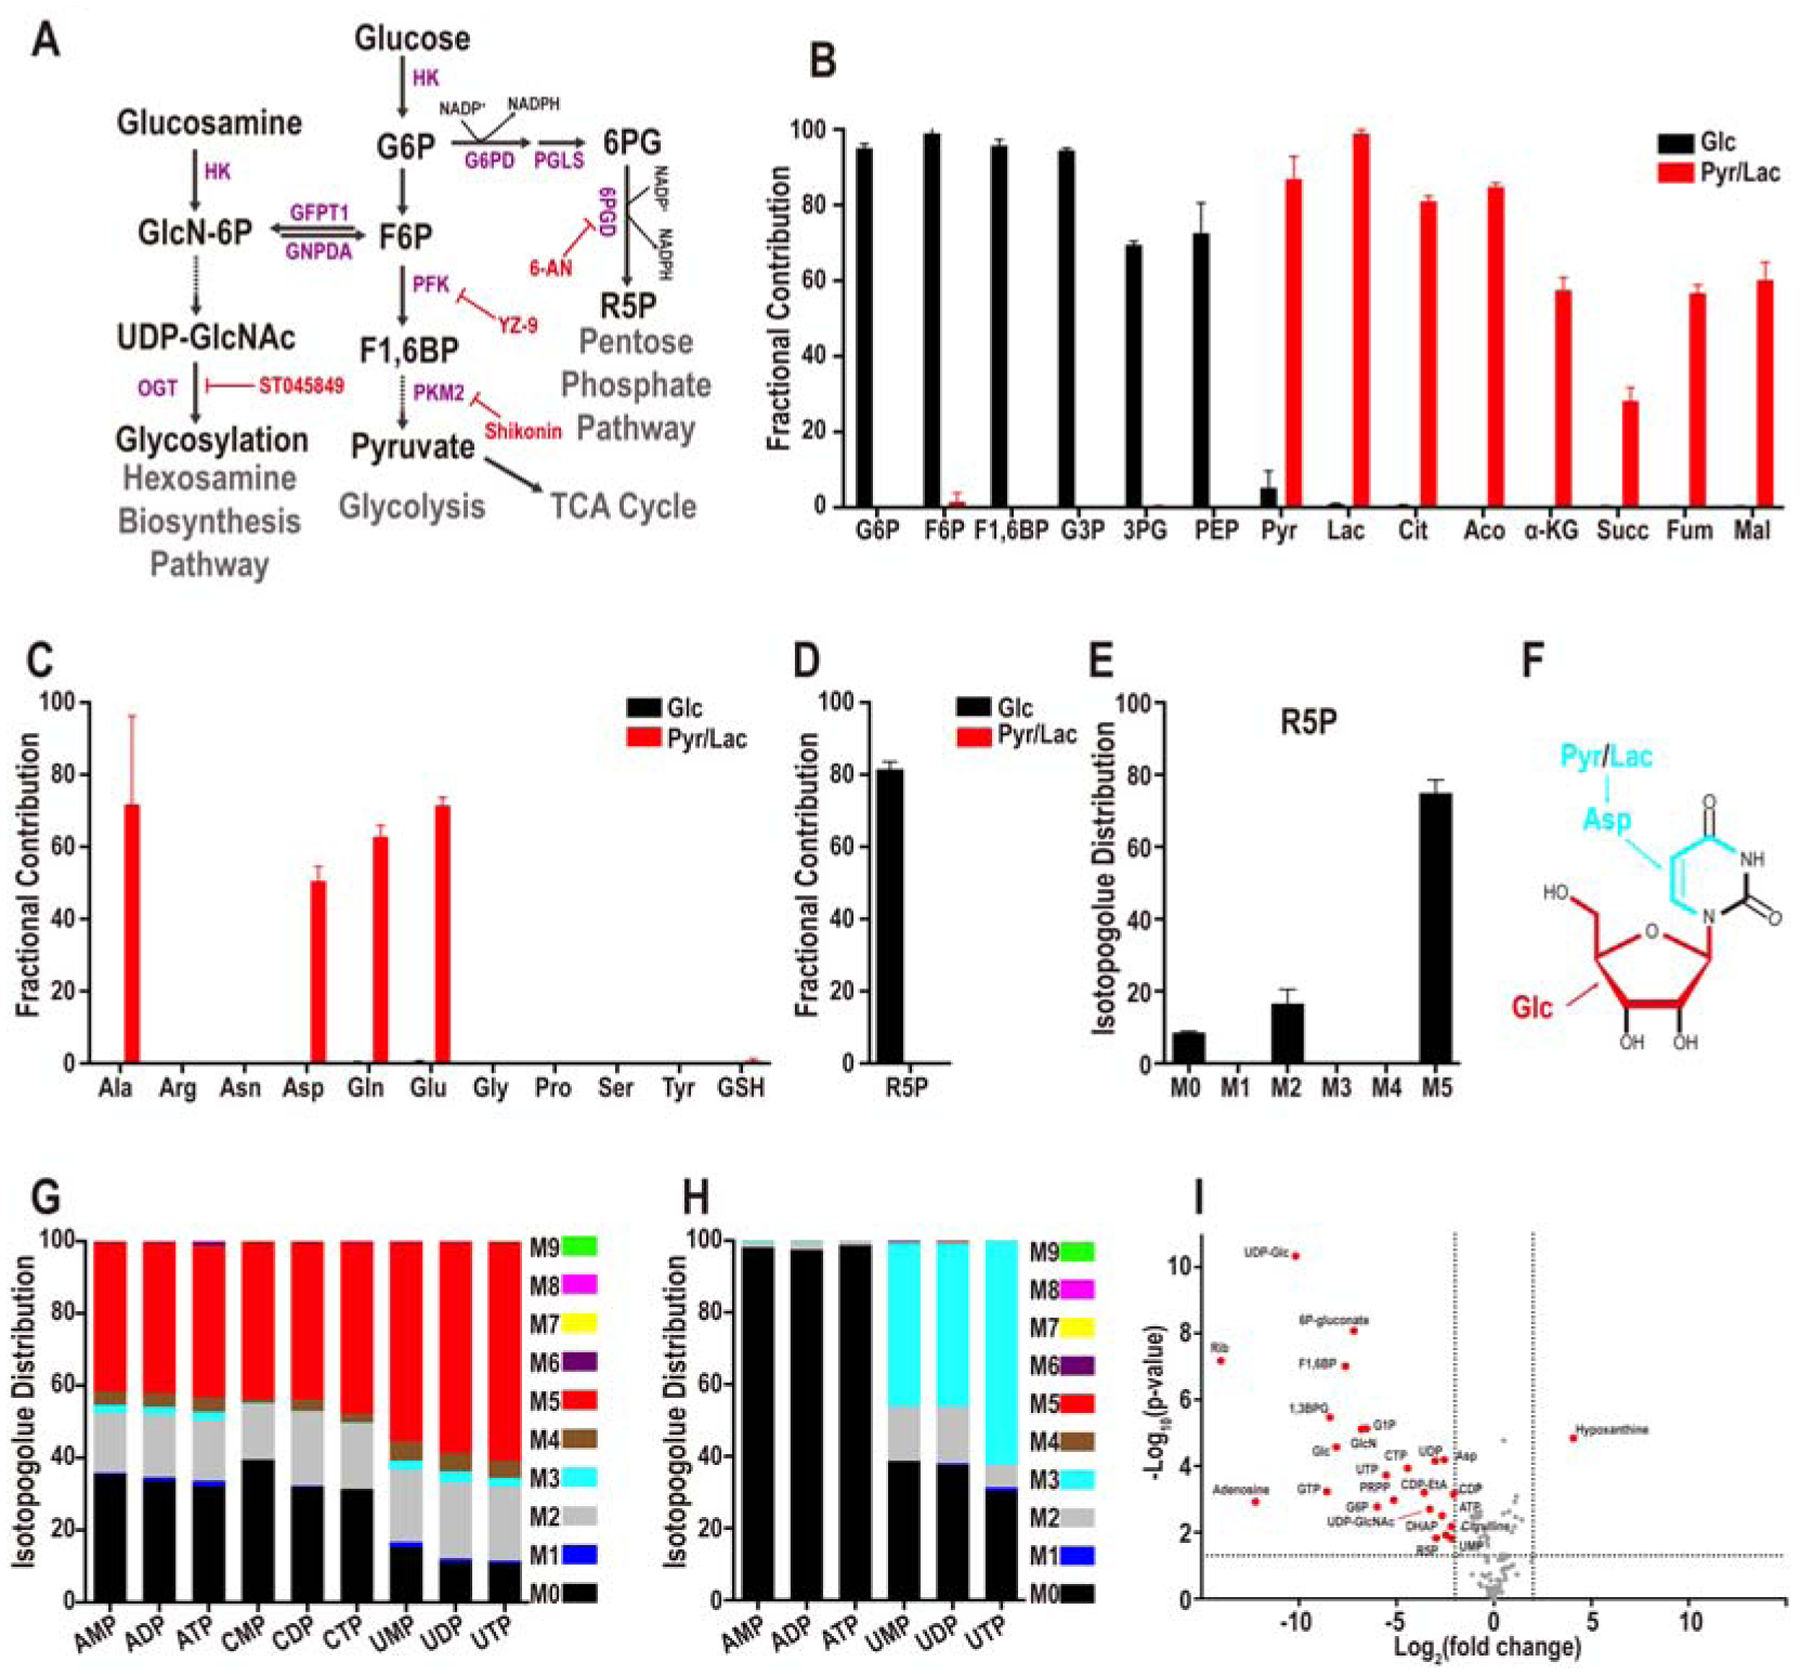
Figure 2. Metabolomics analysis of the compacted morula.

(A) Representative steps in glucose metabolism.
(B) U-13C glucose (black bars) contributes to glycolytic intermediates but not to TCA cycle metabolites while U-13C pyruvate+lactate (red bars) contribute to TCA intermediates.
(C) Glucose (black) does not contribute carbons to amino acids and contribution of pyruvate/lactate (red) carbons is limited to the four amino acids, Ala, Asp, Gln, and Glu.
(D, E) Fractional contribution of U-13C glucose (black) and U-13C pyruvate/lactate (red) (D) to the PPP metabolite ribose-5-phosphate (R5P), and glucose isotopologue distribution of R5P (E). The most abundant isotopologue is M5 in which 5 of the donated carbons are from exogenous U-13C-glucose (black). M0 peak corresponds to unlabeled metabolites from internal resources. The origin of the M2 peak is unknown.
(F-H) Structural representation of uridine (F). Glucose contributes 5 carbons to the ribose sugar (red), while pyruvate/lactate contributes 3 carbons to the base (light blue), via aspartate for de novo pyrimidine biosynthesis. (G) U-13C glucose contributes carbons to all nucleotides. No isotopologues greater than M5 are detected suggesting that only the ribose ring of the nucleotides is synthesized from glucose. (H) U-13C pyruvate/lactate contributes 3 carbons (light blue) to pyrimidine based nucleotides (e.g. UMP, UDP, UTP), and no carbons (M0) from pyruvate/lactate are used to populate purine nucleotides (e.g. AMP, ADP, ATP).
(I) Identification of glucose sensitive metabolites. 25 metabolites (red) differ by more than 4-fold (P< 0.05). Metabolites that do not meet this criterion are marked in grey.
