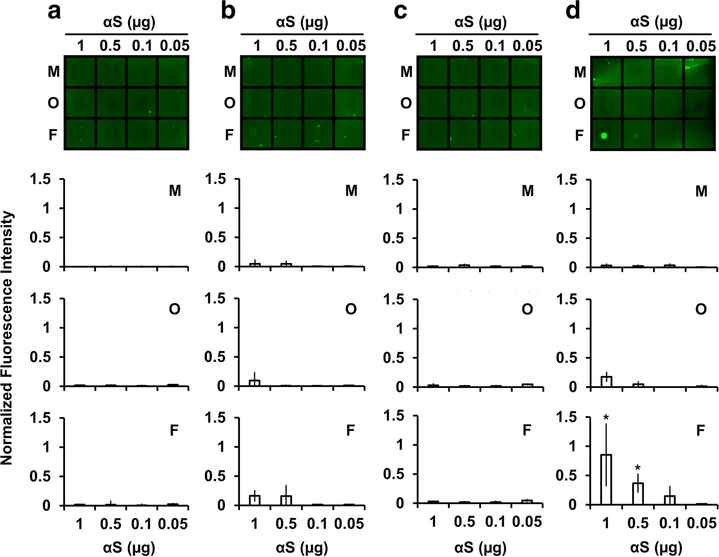
Figure 2.
Fluorescent dot blot assays of αS using (A) FITC-ELVFWAE, (B) FITC-KLVFWAK, (C) capped FITC-ELVFWAE, and (D) capped FITC-KLVFWAK. Top: representative membrane images where αS in monomeric (M), oligomeric (O) and fibrillar (F) conformers were dotted at 0.05 – 1 μg each, and then incubated with FITC-labeled peptide solutions, followed by washing off unbound peptides and subsequent visualization of the bound peptides using fluorescence. Bottom three plots: fluorescence intensities of the membranes for monomeric (M), oligomeric (O), and fibrillar (F) αS at 0.05 – 1 μg were quantified by a MATLAB-based image analysis. Fluorescence intensities were normalized to the fluorescence signals of each FITC-labeled peptide at 1 μg directly dotted onto the membrane. Error bars: 1 SD from at least two independent experiments. *: p < 0.05 relative to normalized background intensity (0 ± 0.08, n = 4)

