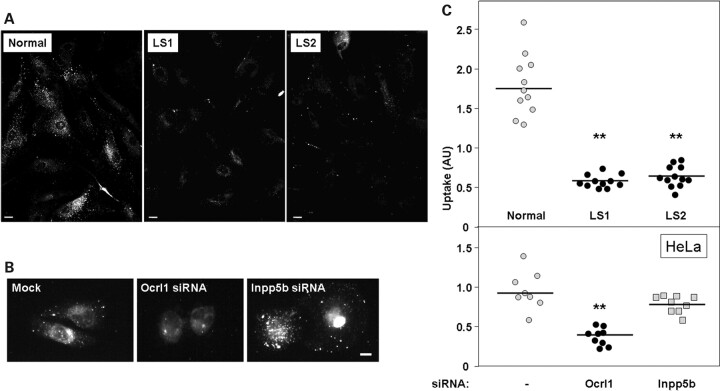
Figure 10.
Dermal fibroblasts from LS patients display defects in fluid-phase uptake. (A) The amount of TMR-labeled 70 KDa dextran taken up by normal and LS patient cells was determined as described under Materials and Methods. After fixation cells were imaged using a rhodamine filter. Scale bar: 20 µm. (B). HeLa cells were mock-treated or subjected to siRNA-mediated knock-down of Ocrl1 or Inpp5b. After 72 h, cells were assayed for their ability to internalize TMR-dextran as described in (A). Scale bar: 10 µm. (C) TMR-labeled 70 KDa dextran uptake was quantified as described under Materials and Methods. Results from nine different experiments (involving 72–180 cells) are shown for indicated samples. The corresponding median is indicated by a horizontal line. Statistical significance of fluid-phase uptake phenotype with respect to control (Normal or Mock) was assessed by using the Wilcoxon test (**P < 0.05).

