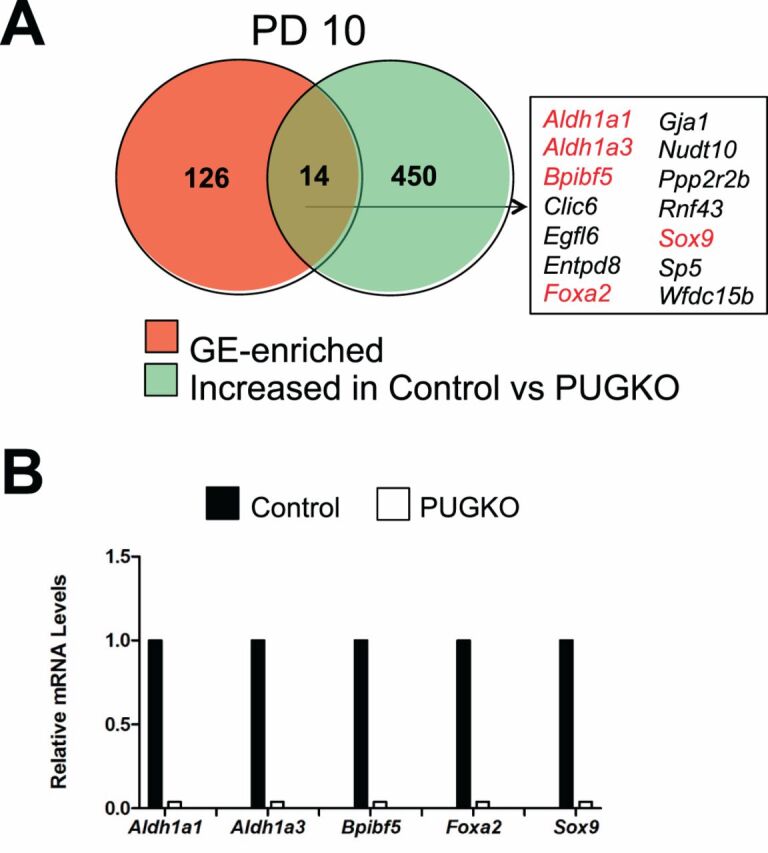
Fig. 4.

Genes enriched in the uterine glands of neonatal mice.A) Venn diagram is presented showing intersection between GE-enriched genes and genes increased in the uteri of control as compared to PUGKO mice on PD 10 as determined by microarray analysis. Genes marked in red were validated by RT-PCR analysis.B) Validation of selected GE-enriched genes by semiquantitative RT-PCR analysis. Relative mRNA levels of the indicated genes were measured in the uteri of control and PUGKO mice on PD 10 (n = 4 mice/day/treatment). Real-time PCR data are presented as fold change relative to the mRNA level in uteri from control mice.
