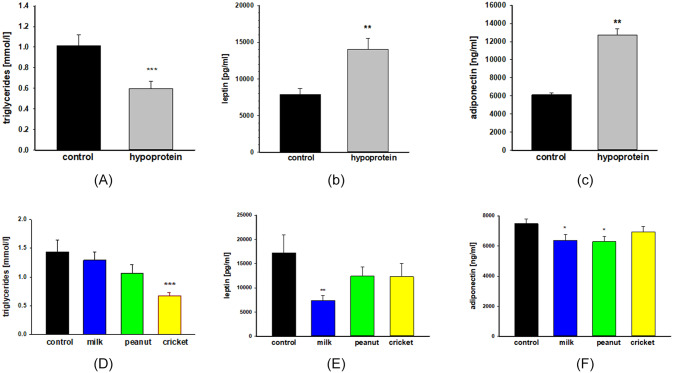
Fig 3. Metabolic markers.
Serum levels of triglycerides (A, D), leptin (B, E) and adiponectin (C, F) after 2 weeks of protein malnutrition (A-C) and after 6 weeks of the recovery period (D-F). Triglyceride were analyzed using EnzyChrom Triglyceride Assay kit. Leptin and adiponectin were assayed using Quantikine ELISAs. One-way ANOVA analysis was used to determine difference between experimental groups (hypoprotein, milk, peanut, and cricket diets) and controls group (2018 diet). Results are expressed as means ± SE. n = 10-12/group, * p< 0.05, **p< 0.01, ***p< 0.001.

