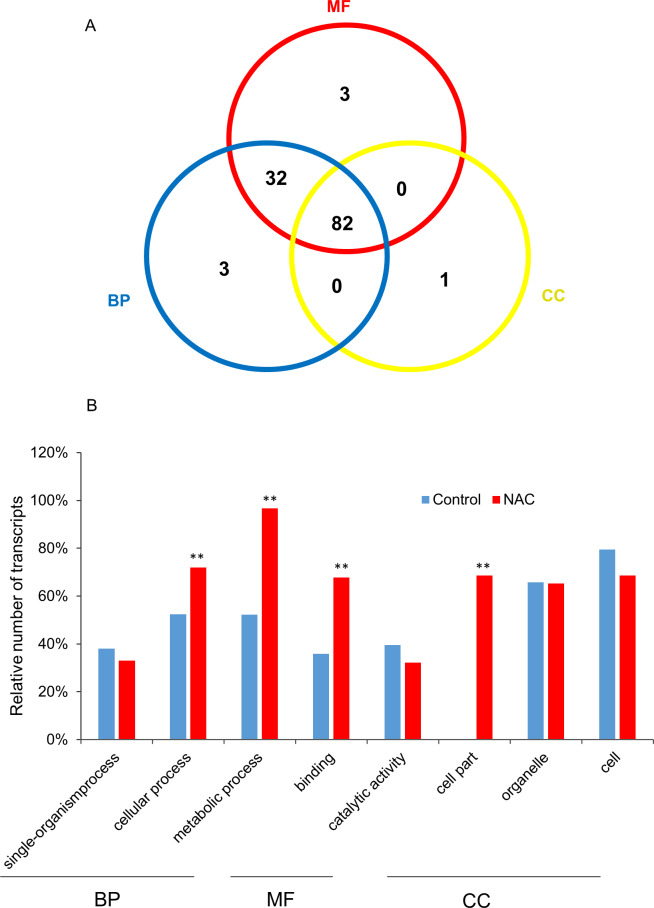
Fig 3. Functional categorization of the PgNAC transcripts.
(A) Venn diagram of the primary functional categorization of the PgNAC transcripts. BP, biological process; MF, molecular function; and CC, cellular component. (B) functional categorization of the PgNAC transcripts at Level 2 and their enrichments. The GO terms of the transcripts expressed in the 14 tissues of a four-year-old plant were used as the background control for the enrichment analysis. **, significant at P ≤ 0.01.

