. 2020 Jun 11;128(6):067008. doi: 10.1289/EHP6471

Figure 1.

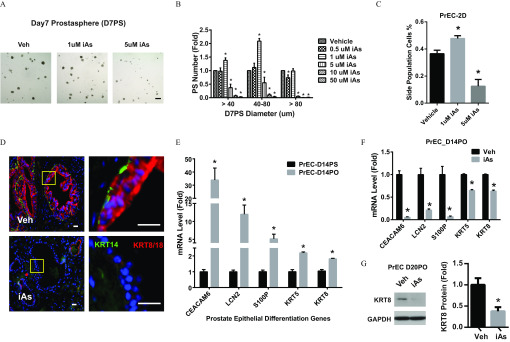
Figure 1A is a set of three schematics titled Day7 Prostasphere (D7PS), displaying Veh, 1 microMolar iAs, and 5 microMolar iAs. Figure 1B is a bar graph, plotting PS Number (fold), ranging from 0.0 to 2.5 in increments of 0.5 (y-axis) across D7PS diameters in micrometers, namely, greater than 40, 40 to 80, and greater than 80 (x-axis) for vehicle, 0.5 micrometer iAs, 1 microMolar iAs, 5 microMolar iAs, 10 microMolar iAs, and 50 microMolar iAs. Figure 1C is a bar graph titled PrEC-2D, plotting side population cells in percentage, ranging from 0.0 to 0.6 in increments of 0.2 (y-axis) across vehicle, 1 microMolar iAs, and 5 microMolar iAs. Figure 1D is an immunostaining of KRT14 and KRT8/18, Veh. And iAs presented in a four-quadrant structure. Figure 1E is a bar graph, plotting mRNA level (fold), ranging from 0 to 2 in unit increments, 5 to 15 in increments of 5, and 20 to 50 in increments of 10 (y-axis) across prostate epithelial differentiation genes, namely, CEACAM6, LCN2, S100P, KRT5, and KRT8 (x-axis) for PrEC-D14PS and PrEC-D14PO. Figure 1F is a bar graph titled PrEC_D14PO, plotting mRNA level (fold), ranging from 0.0 to 1.5 in increments of 0.5 (y-axis) across CEACAM6, LCN2, S100P, KRT5, and KRT8 (x-axis) for Veh and iAs. Figure 1g is a set of a western blot and a bar graph. The western blot titled PrEC D20PO, has two columns and two rows, namely, Veh and iAs and KRT8 and GAPDH, respectively. The bar graph plots KRT8 protein (fold), ranging from 0.0 to 1.5 in increments of 0.5 (y-axis) across Veh and iAs (x-axis).

Effects of arsenic on self-renewal and differentiation of prostate stem-progenitor cells. (A,B) Prostate spheres (PS) derived from primary human prostate epithelial cells (PrEC) were cultured with inorganic arsenic (iAs) at indicated doses for 7 d (PrEC-D7PS) (A) and quantified according to size (B). Scale bar=200μm. Data shown are mean±SEM (n=34); *p<0.05 vs. vehicle. (C) Percentage of stem-like cell side population in 2-dimensional cultured PrEC (PrEC-2D) using a Hoechst exclusion side-population assay. Data shown are mean±SEM (n=3); *p<0.05 vs. vehicle. (D) Immunostaining of KRT14 and KRT8/18 in recombinant human rat prostate gland structures in nude mice renal grafts exposed to vehicle or 5 ppm iAs in drinking water for 3 months. Red: KRT14, basal epithelial cells. Green: KRT8/18, luminal epithelial cells. Scale bar=20μm (left: low power; right: high power). (E) mRNA level of prostate epithelial differentiation genes in 2-wk cultured prostate organoid (D14PO) and prostate spheres (D14PS) derived from PrEC. Data shown are mean±SEM (n=4); *p<0.05 vs. D14PS. (F) mRNA levels of prostate epithelial differentiation genes in D14PO treated ±1μM arsenic. Data shown are mean±SEM (n=4); *p<0.05 vs. vehicle. (G) KRT18 protein level of D20PO treated /+1μM arsenic. Data shown are mean±SEM (n=3); *p<0.05 vs. vehicle.