. 2020 Jun 11;128(6):067008. doi: 10.1289/EHP6471

Figure 2.

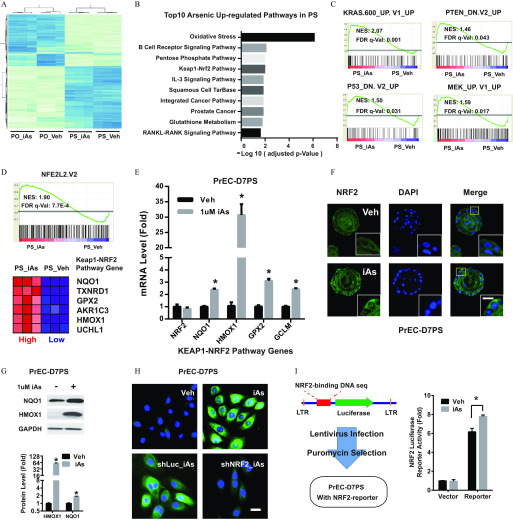
Figure 2A is a heatmap, displaying top 1000 differentially expressed genes (y-axis) across PO_iAs, PO_Veh, PS_iAs, and PS_Veh (x-axis). Figure 2B is a horizontal bar graph titled Top 10 Arsenic up-regulated pathways in PS, plotting oxidative stress, B cell receptor signaling pathway, pentose phosphate pathway, kEAP1-Nrf2 pathway, lL-3 signaling pathway, squamous cell TarBase, Integrated cancer pathway, prostate cancer, glutathione metabolism, and RANKL-RANK signaling pathway (y-axis) across negative log of 10 (adjusted p-value), ranging from 0 to 8 in increments of 2 (x-axis). Figure 2C is a set of four graphs titled KRAS.600_UP.V1_UP, PTEN_DN.V2_UP, P53_DN.V2_UP, and MEK_UP.V1_UP, respectively. The first graph ranges from 0.0 to 0.5 in unit increments, and the rest from negative 0.2 to 0.4 in unit increments (y-axis) across PS_iAs and PS_Veh (x-axis), with NES and FDR q-Val values 2.07 and 0.001, 1.46 and 0.043, 1.50 and 0.031, and 1.59 and 0.017, respectively. Figure 2D is a set of a graph and a schematic. The graph ranges from negative 0.1 to 0.4 in unit increments (y-axis) across PS_iAs and PS_Veh, with NES and FDR q-Val values 1.90 and 7.7E to 4. The schematic has two rows labeled PS_iAs, high and PS_Ve, low, plotting KEAP1-NRF2 Pathway genes, namely, NQO1, TXNRD1, GPX2, AKR1C3, HMOX1, and UCHL1. Figure 2E is a bar graph titled PrEC-D 7PS, plotting mRNA level (Fold), ranging from 0 to 5 in unit increments and from 20 to 40 in increments of 5 (y-axis) across Keap1-NRF2 Pathway genes, namely, NRF2, NQO1, HMOX1, GPX2, and GCLM (x-axis) for Veh and 1 microMolar iAs. Figure 2F is an immunostaining of PrEC-D7PS with three columns and two rows, namely, NRF2, DAPI, and Merge and Veh and iAs, respectively. Figure 2G is a set of three western blots and a bar graph. The immunoblots of PrEC D7PS are labeled NQO1, HMOX1, and GAPDH for positive and negative 1 microMolar iAs. The bar graph plots protein level (fold), ranging from 0.5 to 8 in increments of 0.5 till 1, unit till 2, and 2 till 8 and from 16 to 128 in increments of times 2 (y-axis) across HMOX1 and NQO1 (x-axis) for Veh and iAs. Figure 2H is an immunostaining of PrEC-D7PS in a four-quadrant structure labeled iAs, Veh, shLuc_iAs, and shNRF2_iAs. Figure 2I is a set of a schematic and a bar graph. The schematic displays a scale starting and ending with LTR, comprising NRF2-binding DNA seq and Luciferase with a forward arrow in between. This along with Lentivirus infection and Puromycin Selection leads to PrEC-D7PS with NRF2-reporter. The bar graph plots NRF2 luciferase reported activity (fold), ranging from 0 to 10 in increments of 2 (y-axis) across Vector and reported (x-axis) for Veh and iAs.

Effects of arsenic on the NRF2 pathway in prostate stem-progenitor cells. (A) Heatmap showing the top 1,000 differentially expressed genes across four groups: prostate spheres /+ arsenic (PS_Veh, PS_iAs), prostate organoids /+ arsenic (PO-Veh, PO-iAs). Prostate spheres and organoids were derived from primary human prostate epithelial cells (PrEC), and cultured /+1μM arsenic for 2 wk. (B) Top 10 iAs up-regulated pathways in prostate spheres, iAs up-regulated genes (fold change>2, adjusted p<0.05) were sorted for pathway analysis with Wikipathway. (C) Enriched oncogenic pathways in PS_iAs group vs. PS_Veh group. Raw microarray data were subject to GSEA analysis using gene sets of oncogenic signatures. (D) GSEA data showing NRF2 pathway enrichment between PS-iAs and PS-Veh groups (top) and most regulated genes of NRF2 pathway (bottom). (E) mRNA level of NRF2 pathway genes in PS_Veh and PS_iAs group. Data shown are mean±SEM (n=4); *p<0.05 vs. vehicle. (F) Representative NRF2 immunostaining showing nuclear translocation in PS upon 1μM iAs treatment for 7 d (PrEC-D7PS). Scale bar=20μm. (G) Immunoblot of HMOX1 in PrEC-D7PS /+1μM iAs treatment. Data shown are mean±SEM (n=3); *p<0.05 vs. vehicle. (H) Representative HMOX1 immunostaining in day-7 spheres derived from primary human prostate epithelial cells (PrEC-D7PS) with indicated treatment, n>4. iAs, 1μM arsenic; shLuc, negative control shRNA targeting luciferase gene; shNRF2, shRNA targeting NRF2 gene; Veh, vehicle control. Scale bar=20μm. (I) NRF2-luciferase reporter assay showing luciferase activity in PrEC-D7PS /+1μM iAs. Data shown are mean±SEM (n=4); *p<0.05 vs. vehicle.