. 2020 Jun 11;128(6):067008. doi: 10.1289/EHP6471

Figure 3.

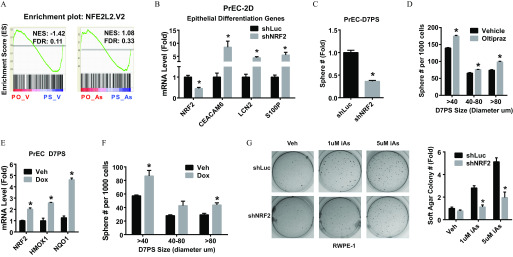
Figure 3A is a set of two graphs titled Enrichment plot: NFE2L2.V2, plotting Enrichment score (ES), ranging from negative 0.3 to 02 in unit increments (y-axis) across PO_V and PS_V and PO_AS and PS_AS, respectively (x-axis), with NES and FDR values negative 1.42 and 0.11 and 1.08 and 0.33, respectively. Figure 3B is a bar graph titled PrEC-2D, Epithelial Differentiation Genes, plotting mRNA (level), ranging from 0 to 1 in unit increments and 5 to 15 in increments of 5 (y-axis) across NRF2, CEACAM6, LCN2, and S100P (x-axis) for shLuc and shNRF2. Figure 3C is a bar graph titled PrEC-D7PS, plotting sphere number (fold), ranging from 0.0 to 1.5 in increments of 0.5 (y-axis) across shLuc and shNRF2 (x-axis). Figure 3D is a bar graph, plottingD7PS size (diameter in micrometer), namely, greater than 40, 40 to 80, and greater than 80 (x-axis) for vehicle and Oltipraz. Figure 3E is a bar graph titled PrEC D7PS, plotting mRNA levels (folds), ranging from 0 to 6 in unit increments (y-axis) across NRF2, HMOX1, and NQO1 (x-axis) for Veh and Dox. Figure 3F is a bar graph, plotting sphere number per 1000 cells, ranging from 0 to 100 in increments of 20 (y-axis) across D7PS size (diameter in micrometers), namely, greater than 40, 40 to 80, and greater than 80 (x-axis) for Veh and Dox. Figure 3G is a set of six schematics and a bar graph. The schematics titled RWPE-1 have three columns and two rows, namely, Veh, 1 microMolar iAs, and 5 microMolar iAs and shLuc and shNRF2. The bar graph plots soft agar colony number (fold), ranging from 0 to 6 in increments of 2 (y-axis) across Veh, 1 microMolar iAs, and 5 microMolar iAs (x-axis) for shLuc and shNRF2.

The role of NRF2 plays in iAs-induced transformation. (A) GSEA data of NRF2 pathway genes comparing prostate organoids (PO) and spheres (PS) derived from primary human prostate epithelial cells (PrEC) and treated with vehicle (PO-V vs. PS-V) or 1μM arsenic (PO-As vs. PS-As). (B) Expression of prostate epithelial differentiation genes in 2-dimensional culture PrEC (PrEC-2D) with NRF2 knockdown (shNRF2). Data shown are mean±SEM (n=3); *p<0.05 vs. shRNA control (shLuc). (C) Sphere formation capability of PrEC with NRF2-knockdown, D7PS: day-7 spheres. Data shown are mean±SEM (n=4); *p<0.05 vs. vehicle. (D) Quantification of sphere formation capability of PrEC treated with NRF2-inducer Oltipraz (10μM) for 7 d. D7PS: day-7 prostate spheres. Data shown are mean±SEM (n=4); *p<0.05 vs. vehicle. (E) mRNA level of NRF2 gene and NRF2 pathway marker genes. Tet-On NRF2 expression was induced in PrEC spheres by lentivirus. Spheres were culture/+ doxycycline (Dox, 0.5 ug/mL) for 7 d (Tet-ON-NRF2 PrEC-D7PS) to induce NRF2 overexpression. Data shown are mean±SEM (n=4); *p<0.05 vs. vehicle. (F) Quantification of sphere formation capability of PrEC with Tet-On overexpression of NRF2. Data shown are mean±SEM (n=4); *p<0.05 vs. vehicle. (G) Soft-agar colony formation assay of RWPE1 with indicated treatment. Note: iAs, inorganic arsenic; shLuc, RWPE1 with shRNA targeting luciferase gene, negative control; shNRF2, RWPE1 with NRF2 knockdown. Data shown are mean±SEM (n=4); *p<0.05 vs. shRNA control (shLuc).