. 2020 Jun 11;128(6):067008. doi: 10.1289/EHP6471

Figure 8.

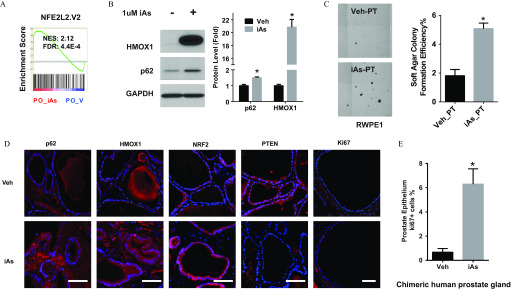
Figure 8A is a graph titled NFE2L2.V2, plotting enrichment score, ranging from negative 0.1 to 0.5 with unit increments (y-axis) across PO_iAs and PO_V (x-axis) for NES is to 2.12 and FDR is to 4.4E 4. Figure 8B is a western blot, displaying negative and positive in 1 microMolar iAs across the top as columns and HMOX1, p62, and GAPDH across the left as rows. A bar graph plots protein level (fold), ranging from 0 to 22 with increments of 2 (y-axis) across p62 and HMOX1 (x-axis) for Veh and iAs. Figure 8C comprises soft-agar transformation assay of prostate stem-progenitor cells: Veh-PT and iAs-PT under RWPE1. A bar graph plots soft agar colony formation efficiency percent, ranging from 0 to 6 with increments of 2 (y-axis) across Veh_PT and iAs_PT (x-axis). Figure 8D is a display of five columns, namely, p62, HMOX1, NRF2, PTEN, and Ki67 across two rows, namely, Veh and iAs of stained tissue. Figure 8E is a bar graph titled chimeric human prostate gland, plotting prostate epithelium ki67 plus cells percent, ranging from 0 to 8 with increments of 2 (y-axis) across Veh and iAs (x-axis).

Assessment of arsenic effects on the NRF2 pathway in the progeny of progenitor cells. (A) GSEA NRF2 pathway enrichment analysis of prostate organoid (PO) treated with 1μM iAs for 14 d. NES, normalized enrichment score. NES=2.12 indicates that NRF2 pathway is enriched in PO_iAs groups. (B) Representative immunoblotting of HMOX1 and p62 in day-14 prostate organoid derived from PrEC (PrEC-D14PO) treated with 1μM iAs for 14 d. Quantification data shown are mean±SEM (n=3); *p<0.05 vs. vehicle. (C) Representative image of soft-agar transformation assay of prostate stem-progenitor cells pretreated with 1μM iAs for 7 d. Quantification data of soft-agar colony formation efficiency are mean±SEM (n=6); *p<0.05 between two groups. (D) Representative immunostaining (n>3) of indicated protein in chimeric human prostate gland structure derived from human PrEC and rat UGM grafted under renal capsule exposed to 5 ppm iAs in drinking water for 3 months. Scale bar=100μm. (E) Quantitative data of Ki67 positive cell percent in chimeric human prostate gland. Data shown are mean±SEM (n=5 chimeric gland); *p<0.05 between two groups.