
Fig. 2.
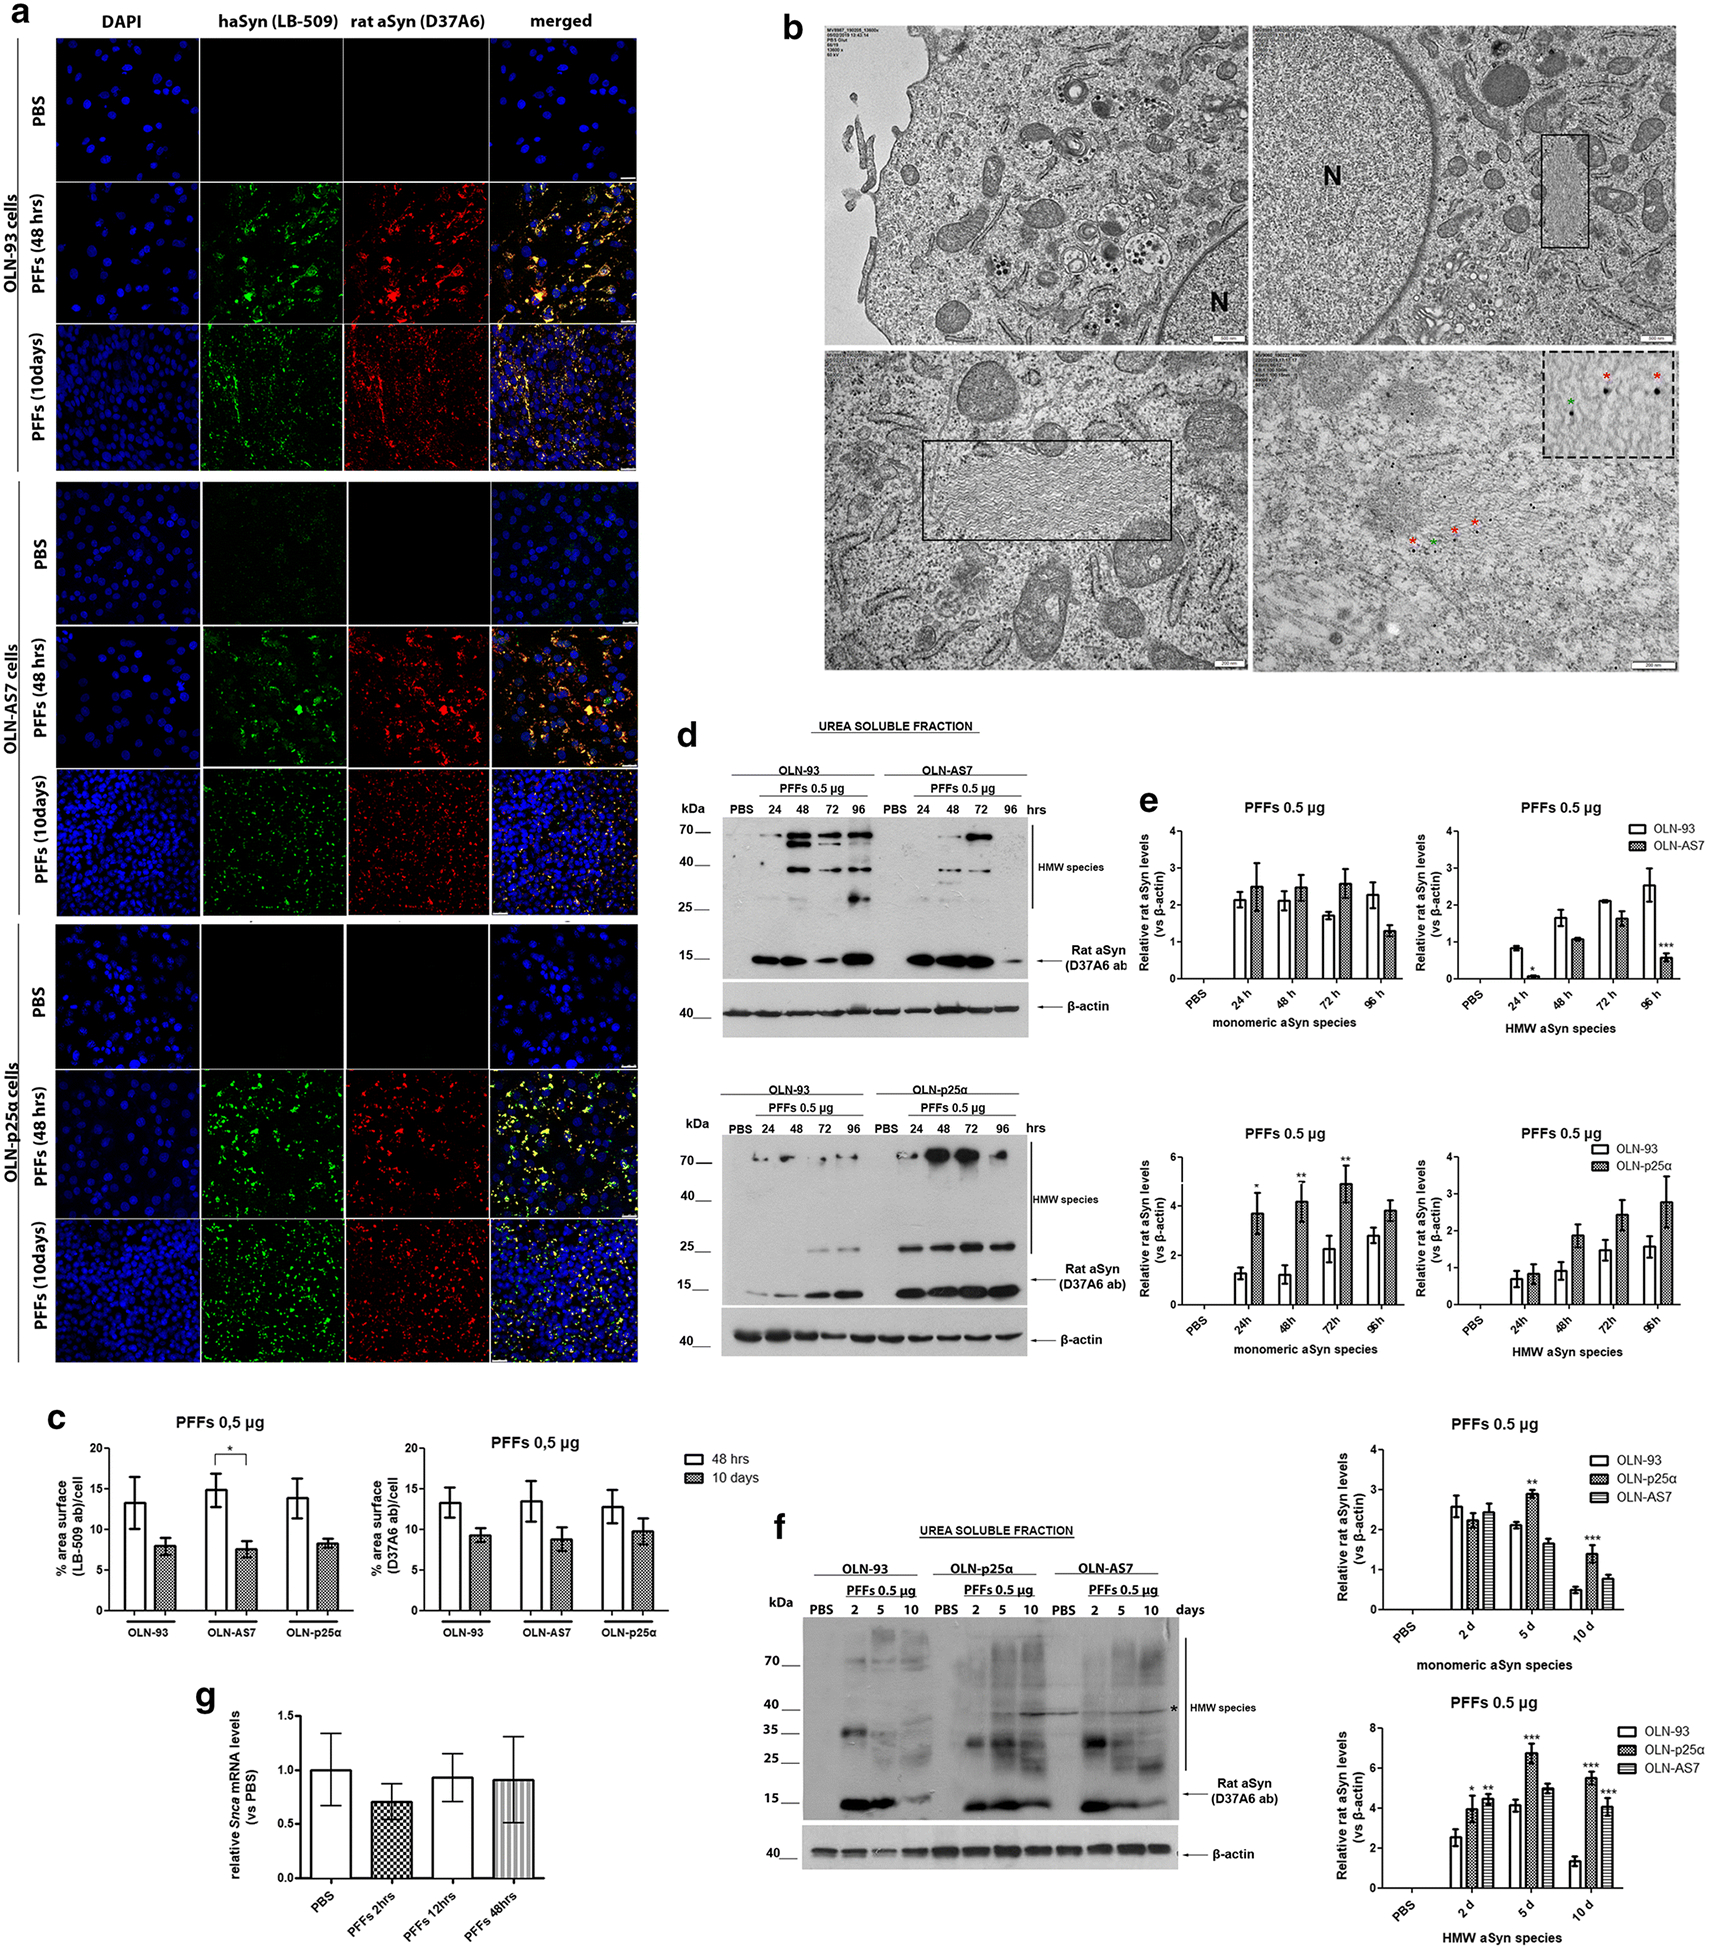
Addition of haSyn PFFs in OLN cell lines leads to the recruitment of endogenous rat oligodendroglial aSyn into highly insoluble aSyn assemblies. a Representative immunofluorescence images using antibodies against human aSyn (green, LB509 antibody) and endogenous rat aSyn (red, D37A6 antibody) and DAPI staining in OLN cell lines treated with 0.5 μg of haSyn PFFs for 48 h and 10 days. Scale bar: 25 μm. b (upper panels) Ultrastructural transmission EM analysis of PBS-treated (upper left) and haSyn PFFs-treated (upper right) OLN-93 cells showing the presence of filaments (box highlight) in the cell soma near the nucleus of PFF-treated cells (N). (bottom left panel) A higher magnification image of the filaments of PFF-treated cultures is shown. (box highlight, bottom right panel) Double immuno-EM analysis with nanogold particles of different diameters, demonstrating the presence of both human (green asterisk, LB-509, 10 nm) and rodent (red asterisk, D37A6, 15 nm) aSyn in the formed filamentous inclusions in the cell soma of OLN-93 cells. A high-power image of independent PFF-treated cultures is shown in the upper dashed box. Scale bars: 500 nm (upper), 200 nm (bottom) and 100 nm (highlight box). c Quantification of aSyn levels (human and endogenous rat) measured as % area surface/cell in OLN cell lines following treatment with 0.5 μg PFFs for 48 h or 10 days. Data are expressed as the mean ± SE of three independent experiments with triplicate samples/condition within each experiment. *p < 0.05 by two-way ANOVA with Bonferroni’s correction. d Representative immunoblots demonstrating the presence of endogenous rat aSyn (D37A6 antibody) in the urea-soluble fraction of OLN-93 and OLN-AS7 cells (upper panel) or OLN-p25α cells (bottom panel) following treatment with 0.5 μg haSyn PFFs for 24–96 h. Equal loading was verified by the detection of β-actin levels. e Quantification of monomeric (left) and HMW species (right) of endogenous rat aSyn levels detected in the urea-soluble fraction of OLN-93 and OLN-AS7 cells (upper row) or OLN-93 and OLN-p25α cells (bottom row) treated with 0.5 μg PFFs for 24–96 h. Data are expressed as the mean ± SE of five independent experiments with triplicate samples/condition within each experiment. *p < 0.05; **p < 0.01; ***p < 0.001, by two-way ANOVA with Bonferroni’s correction. f (left panel) Representative immunoblots of urea-soluble protein fraction derived from OLN-93, OLN-AS7, and OLN-p25α cells treated with 0.5 μg of haSyn PFFs for 2–10 days. Asterisk represents non-specific bands obtained with the rodent-specific D37A6 antibody. (right) Quantification of monomeric (upper row) and HMW species (bottom row) of rat endogenous aSyn detected in the urea-soluble fraction of all OLN cell lines treated with 0.5 μg PFFs for 2–10 days. Data are expressed as the mean ± SE of three independent experiments with triplicate samples/condition within each experiment; *p < 0.05; **p < 0.01; ***p < 0.001, by two-way ANOVA with Bonferroni’s correction, comparing between OLN-93 and OLN-AS7 or OLN-p25α cells treated with haSyn PFFs. g Quantitative real-time PCR reveals unaltered Snca levels upon treatment of OLN-93 cells with 0.5 μg haSyn PFFs for 2–48 h. Data are expressed as Snca mRNA levels relative to the mRNA levels of ß-actin normalized to control-treated cultures (PBS).