
Fig. 7.
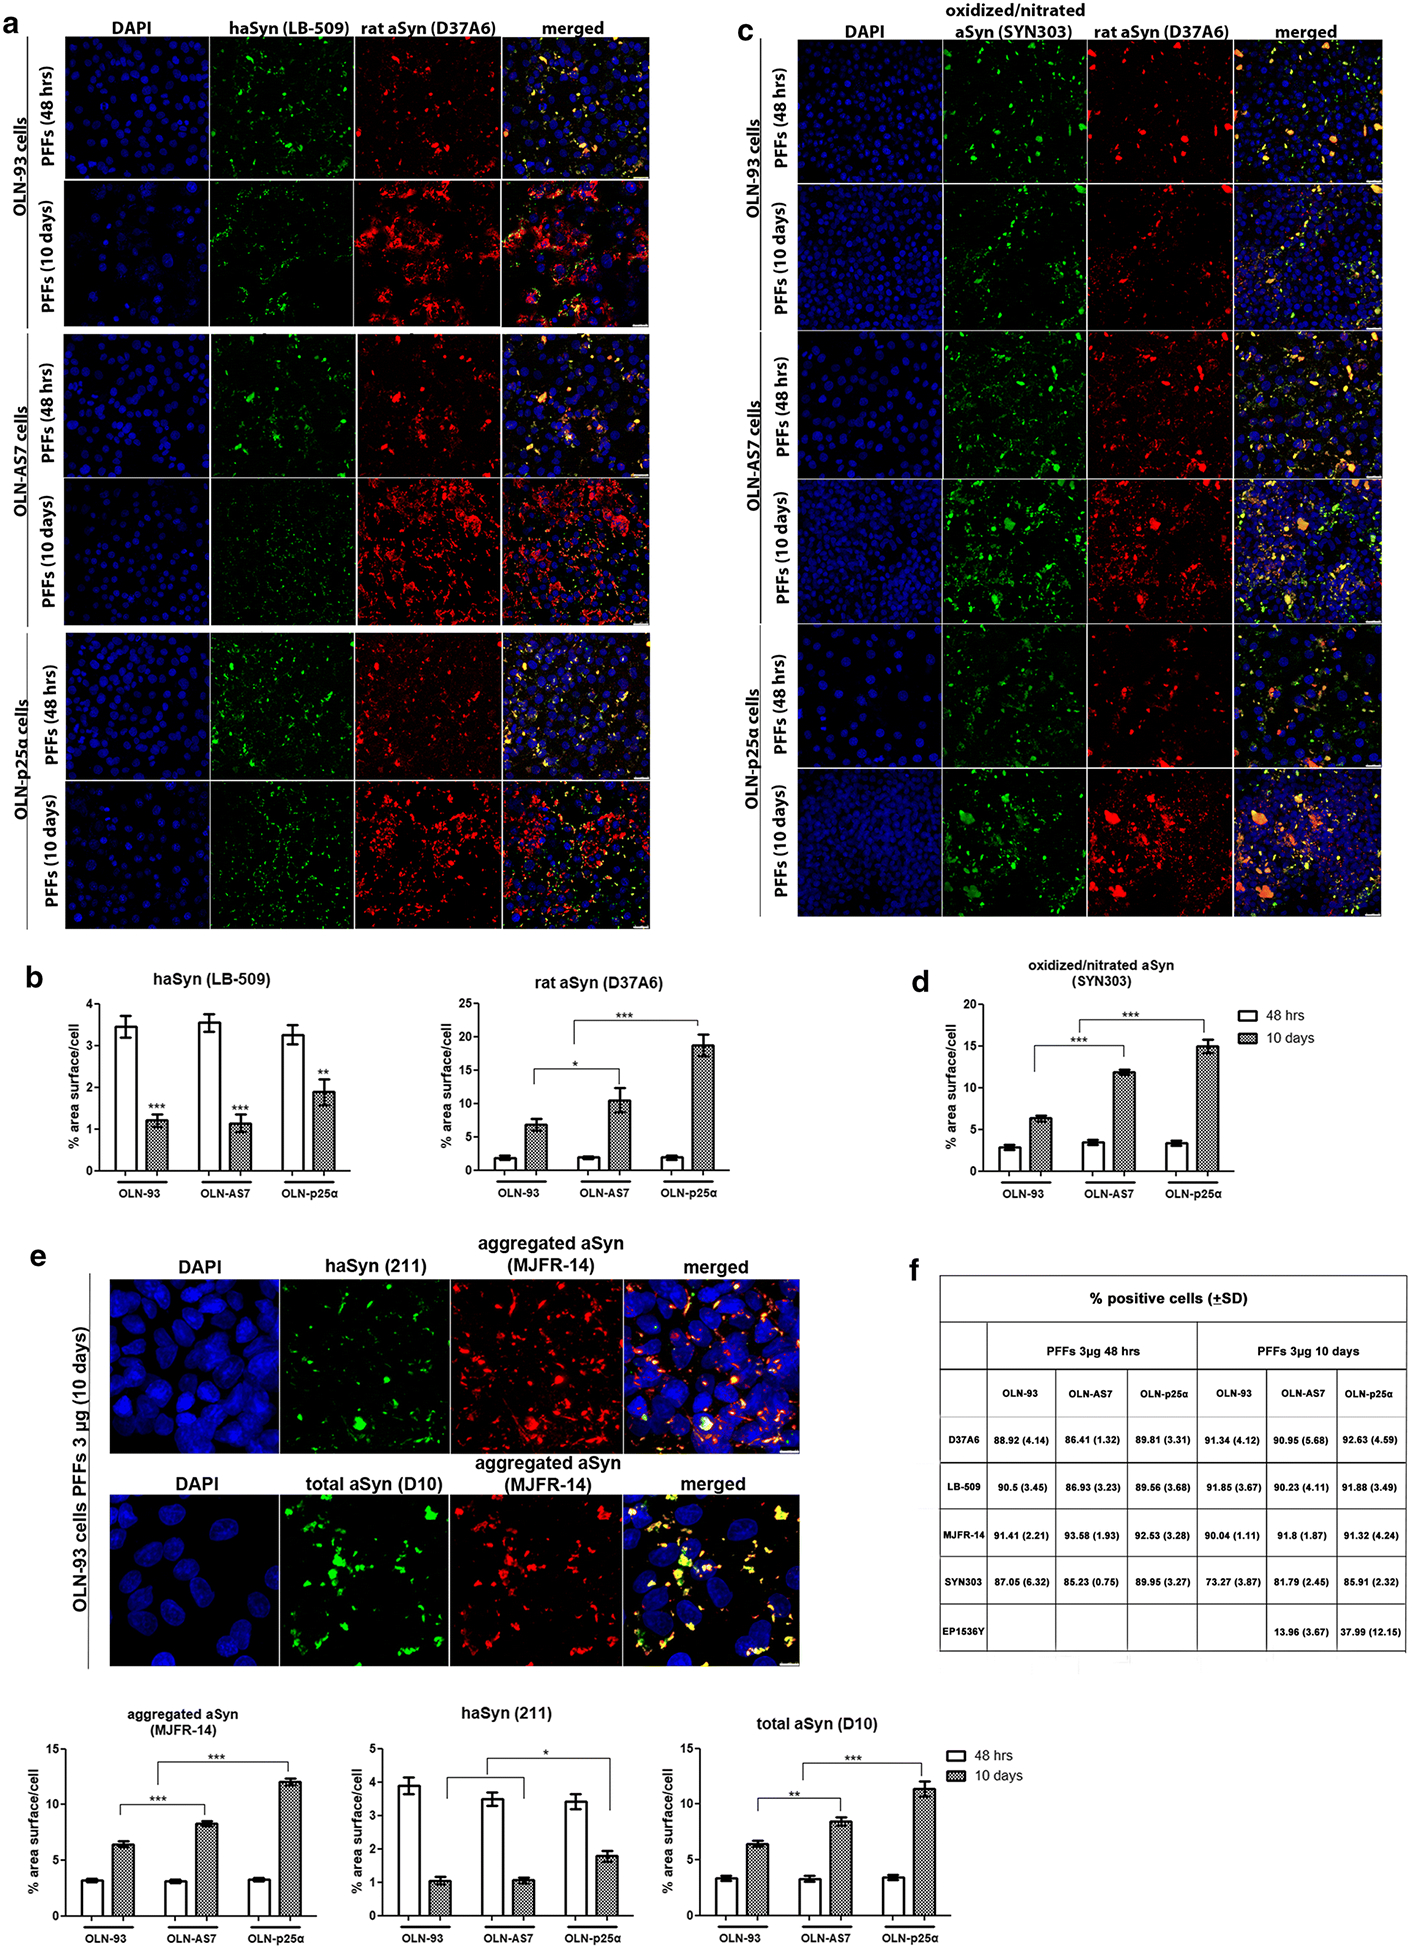
Prolonged incubation of OLN cell lines with high concentrations of haSyn PFFs uncovers the significant contribution of endogenous rat oligodendroglial aSyn to the formation of aberrant aSyn conformations. a, b Over time, the equilibrium of aSyn protein load shifts toward seeded endogenous rodent aSyn in all cell lines. OLN-93, OLN-AS7, and OLN-p25α cells were incubated with 3 μg human aSyn PFFs for 48 h or 10 days, and the recruitment of endogenous rat aSyn was examined by confocal microscopy. a Representative immunofluorescence images with antibodies against human aSyn (green) and endogenous rat aSyn (red) and DAPI staining. Scale bar: 25 μm. b Quantification of human and endogenous rat aSyn protein levels measured as % area surface/cell in OLN cell lines following the addition of 3 μg PFFs for 48 h or 10 days. Data are expressed as the mean ± SE of at least three independent experiments with triplicate samples/condition within each experiment; *p < 0.05; **p < 0.01, ***p < 0.001, by two-way ANOVA with Bonferroni’s correction. c The addition of a high concentration of haSyn PFFs (3 μg) leads to the formation of time-resistant pathological (oxidized/nitrated) aSyn species, in which endogenous rat aSyn is the major constituent, as shown using antibodies against oxidized/nitrated aSyn (green) and endogenous rat aSyn (red), and DAPI staining. Scale bar: 25 μm. d Quantification of oxidized/nitrated aSyn protein levels measured as % area surface/cell in OLN cell lines following the addition of 3 μg PFFs for 48 h or 10 days. Data are expressed as the mean ± SE of at least three independent experiments with triplicate samples/condition within each experiment; ***p < 0.001, by two-way ANOVA with Bonferroni’s correction. e (upper panel) Incubation of OLN cells with 3 μg PFFs for 48 h or 10 days expedites the formation of aggregated conformations of aSyn. Representative immunofluorescence images with antibodies against human aSyn (green, 211 antibody, upper panel), total aSyn (human+rodent, green, D10, bottom panel) and aggregated aSyn (red) and DAPI staining in OLN-93 cells. Scale bar: 7.5 μm. (bottom panels) Quantification of aggregated (left), human (middle), and total (human+rodent) aSyn levels in all OLN cell lines treated with 3 μg haSyn PFFs for 48 h or10 days, expressed as % area surface/cell verifies the aggregated nature of the generated aSyn assemblies and highlights the contribution of recruited endogenous rat aSyn to the formation of such structures. Data are expressed as the mean ± SE of at least three independent experiments with triplicate samples/condition within each experiment; *p < 0.05; **p < 0.01; ***p < 0.001 by two-way ANOVA with Bonferroni’s correction. f Quantification of the percentage of positively stained OLN-93, OLN-AS7 or OLN-p25α cells treated with 3 μg PFFs for 48 h or 10 days with antibodies against endogenous rat (D37A60), human (LB-509), aggregated (MJFR-14) or pathological aSyn species (oxidized/nitrated aSyn [Syn303] or pSer129-aSyn [EP1536Y]). All data are expressed as the mean ± SD of at least three independent experiments with triplicate samples/condition within each experiment.