Fig. 8.

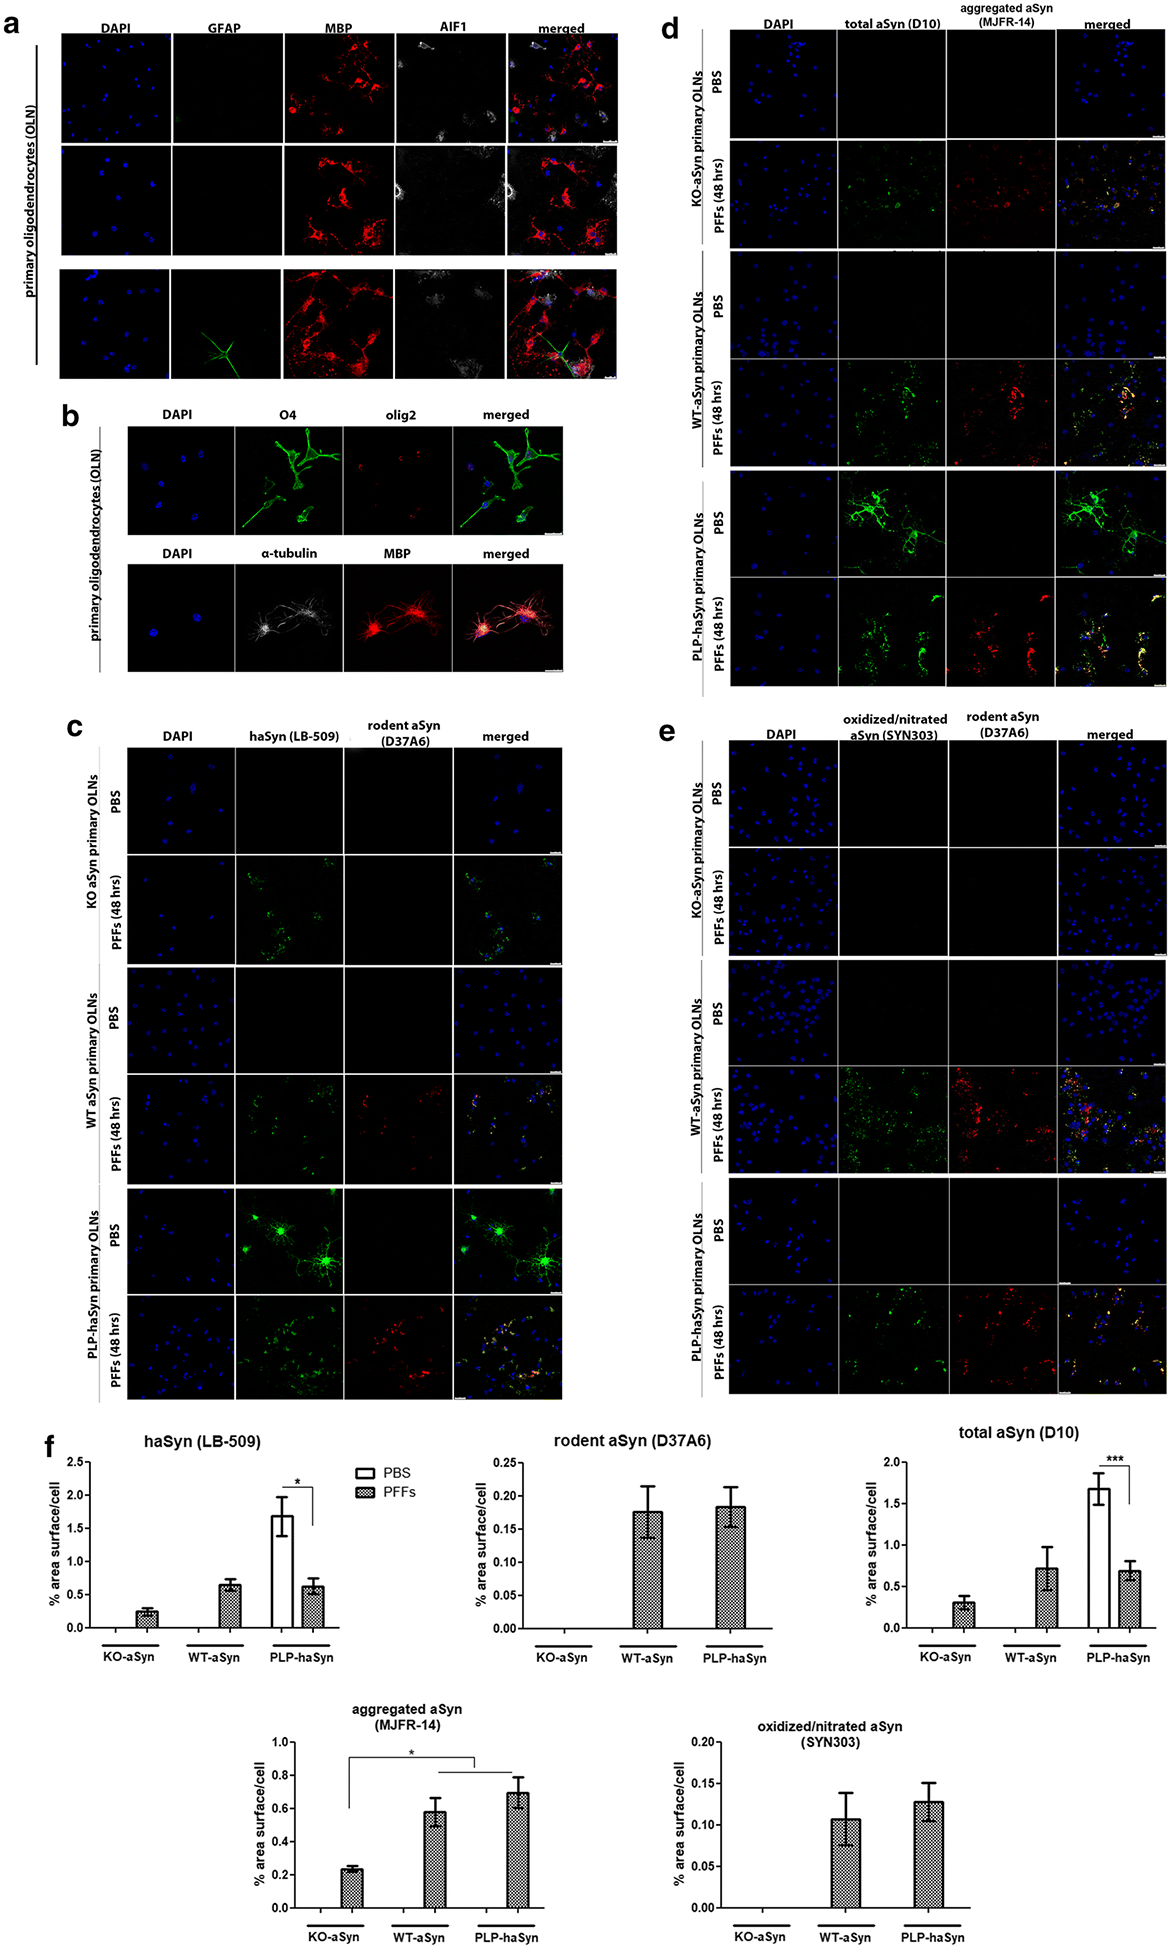
Endogenous mouse oligodendroglial aSyn is incorporated into pathological aSyn assemblies in primary mouse oligodendroglial cultures following the addition of haSyn PFFs. a, b Mouse primary oligodendroglial cells derived from WT-aSyn pups were grown in SATO medium for 7 days prior to fixation and immunofluorescent analysis. The enrichment of the cultures in mature myelin-producing oligodendrocytes was confirmed with confocal microscopy using antibodies against glial fibrillary acidic protein as an astrocytic marker (green, GFAP), allograft inflammatory factor 1 (gray, AIF1/IbaI) as a marker for microglia, and myelin basic protein (red, MBP) as a marker for mature oligodendrocytes (a), as well as against the oligodendroglial markers Olig2 (red, AB9610 antibody) and O4 (green, MAB1326 antibody) (b). α-Tubulin (gray, 62204 antibody) and DAPI staining were used as cytoskeletal and nuclear markers, respectively. Scale bars: 25 μm (a, upper panels), 50 μm (a, bottom panel) and 10 μm (b). c Confocal microscopy with human-specific (green) and rodent-specific (red) aSyn antibodies identifies the enhanced expression of endogenous mouse aSyn in WT-aSyn and PLP-haSyn oligodendroglial cultures, upon the addition of 0.5 μg haSyn PFFs for 48 h. No rodent-specific signal is detected in KO-aSyn cells. d, e Both exogenously added human aSyn and endogenous mouse aSyn contribute to the formation of aggregated (d) and oxidized/nitrated (e) conformations of aSyn in WT-aSyn and PLP-haSyn primary oligodendrocytes incubated with haSyn PFFs. Only exogenously added haSyn PFFs (d) and not oxidized/nitrated (e) conformations are detected in the KO-aSyn cultures. Representative immunofluorescent images using antibodies against total aSyn (green, D10 antibody) and aggregated aSyn (red) are shown in d and against oxidized/nitrated aSyn (green) and endogenous mouse aSyn (red) are shown in e. Scale bar: 25 μm. f Quantification of human, endogenous rodent, and total (human and rodent) aSyn protein levels (upper panel) or aggregated and oxidized/nitrated aSyn protein levels (bottom panel) measured as % area surface/cell in KO-aSyn, WT-aSyn or PLP-haSyn mouse primary oligodendroglial cultures following the addition of 0.5 μg PFFs for 48 h. Data are expressed as the mean ± SE of at least three independent experiments with triplicate samples/condition within each experiment; *p < 0.05; ***p < 0.001, by one-way ANOVA with Tukey’s post-hoc test (to compare between PBS-and PFF-treated cells) or by two-way ANOVA with Bonferroni’s correction (to compare between the different PFF-treated cultures).
