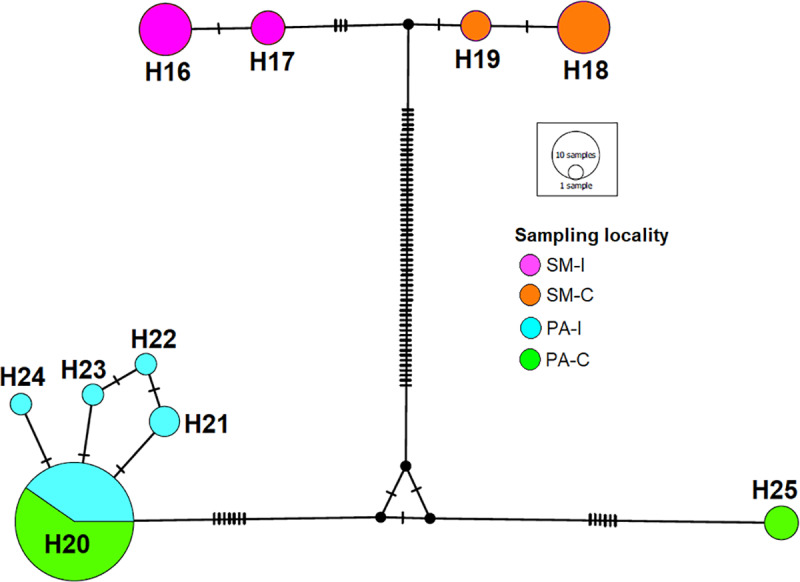
Fig 3. Phylogeographic network.

Unrooted phylogeographic network using COI and cyt b gene sequences with haplotypes depicted according to colors and sampled localities in Fig 1. SM-I: Santa María Island, SM-C: Santa María continent, PA-I: Pan de Azúcar Island, PA-C: Pan de Azúcar continent. Size of circles represents the number of individuals per haplotype.
