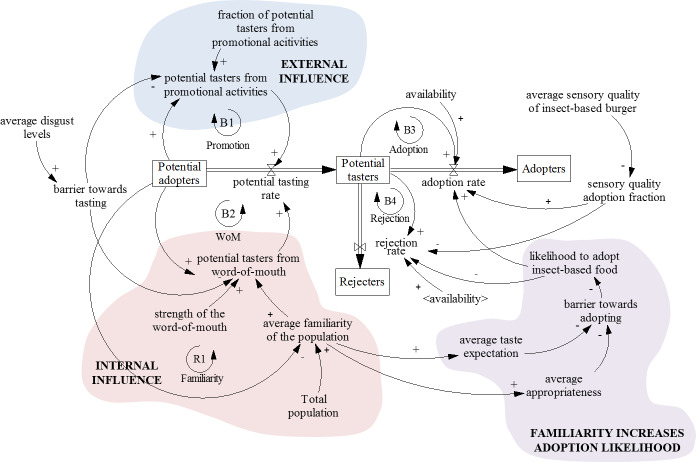
Fig 2. Stock and flow diagram of insect-based food adoption in the Netherlands.
The 
 rate with which “Potential adopters” become “Potential tasters” of insect-based food depends on external influence and internal influence on “Potential adopters”. The rate with which “Potential tasters” become “Adopters” or “Rejecters” depends on their familiarity with insect-based food, which affects adoption likelihood, and average sensory quality of insect-based burger. The running model is in S1 Dataset. (
 positive causal influence–other things being equal, an increase in variable A causes an increase in variable B, or a decrease in variable A causes a decrease in variable B;
  negative causal influence–other things being equal, an increase in variable A causes a decrease in variable B, or a decrease in variable A causes an increase in variable B. Meaning of variables in < >: the variable is copied to avoid decluttering the image with arrows and it is defined elsewhere in the model. balancing feedback loop, reinforcing feedback loop).

