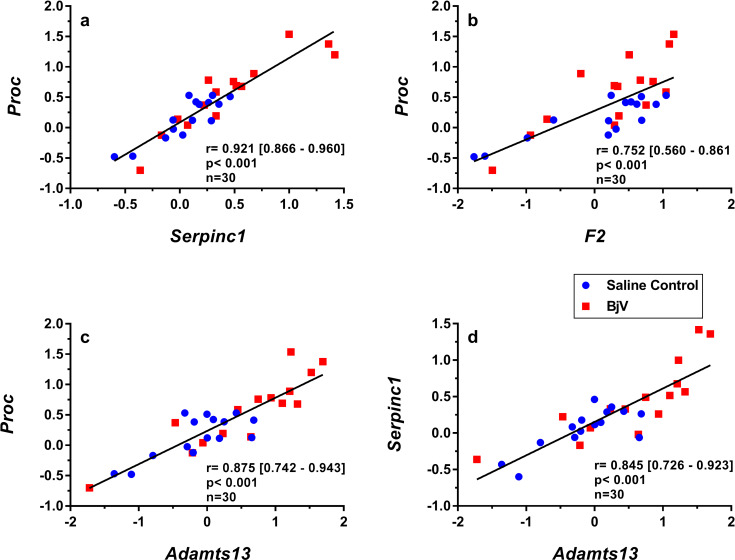
Fig 6.
Scatterplots and linear regressions of paired observations between relative mRNA levels of hemostasis-related genes Proc and Serpinc1 (a), Proc and F2 (b), Proc and Adamts13 (c) and Serpinc1 and Adamts13 (d) in mouse livers at 3, 6 and 24 h after injection of saline (saline control) or Bothrops jararaca venom (BjV). mRNA levels were calculated using 2-ΔΔCT method, using Rplp0 as the reference gene. A pool of mRNA from six normal mouse livers was employed as the reference sample. Data were expressed as relative mRNA levels based on ΔΔCT values (n = 30). Pearson’s correlation was used, and results were expressed as correlation coefficient (r) and 95% confidence interval between square brackets.

