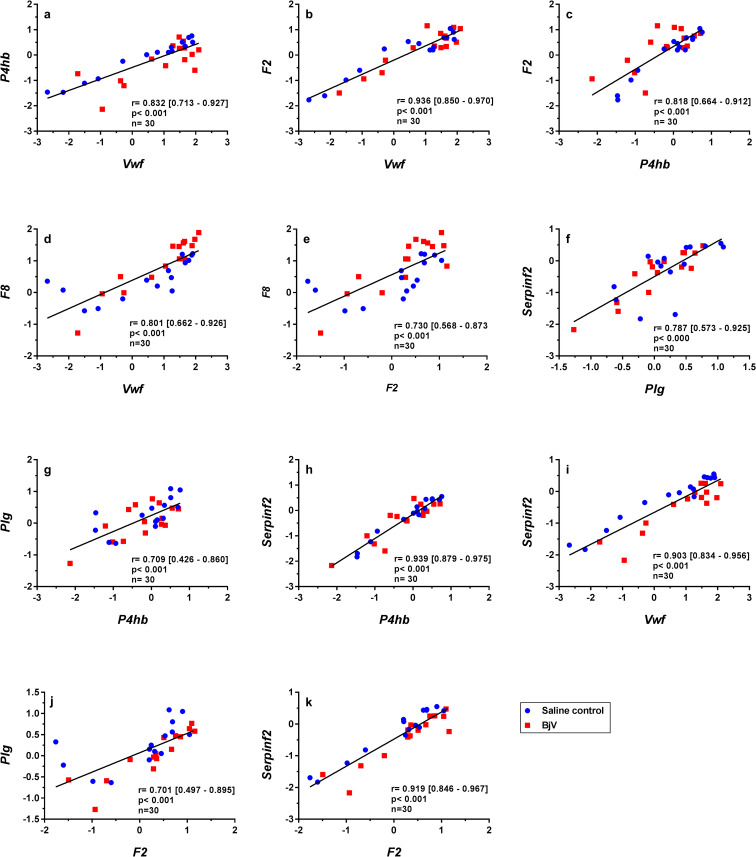
Fig 7.
Scatterplots and linear regressions of paired observations between relative mRNA levels of hemostatic genes P4hb and Vwf (a), F2 and Vwf (b), F2 and P4hb (c), Vwf and F8 (d), F2 and F8 (e), Serpinf2 and Plg (f), Plg and P4hb (g), Serpinf2 and P4hb (h), Serpinf2 and Vwf (i), Plg and F2 (j) and Serpinf2 and F2 (k) in mouse livers at 3, 6 and 24 h after injection of saline (saline control) or Bothrops jararaca venom (BjV). mRNA levels were calculated using 2-ΔΔCT method, using Rplp0 as the reference gene. A pool of mRNA from six normal mouse livers was employed as the reference sample. Data were expressed as relative mRNA levels based on ΔΔCT values (n = 30). Pearson’s correlation was used, and results were expressed as correlation coefficient (r) and 95% confidence interval between square brackets.

