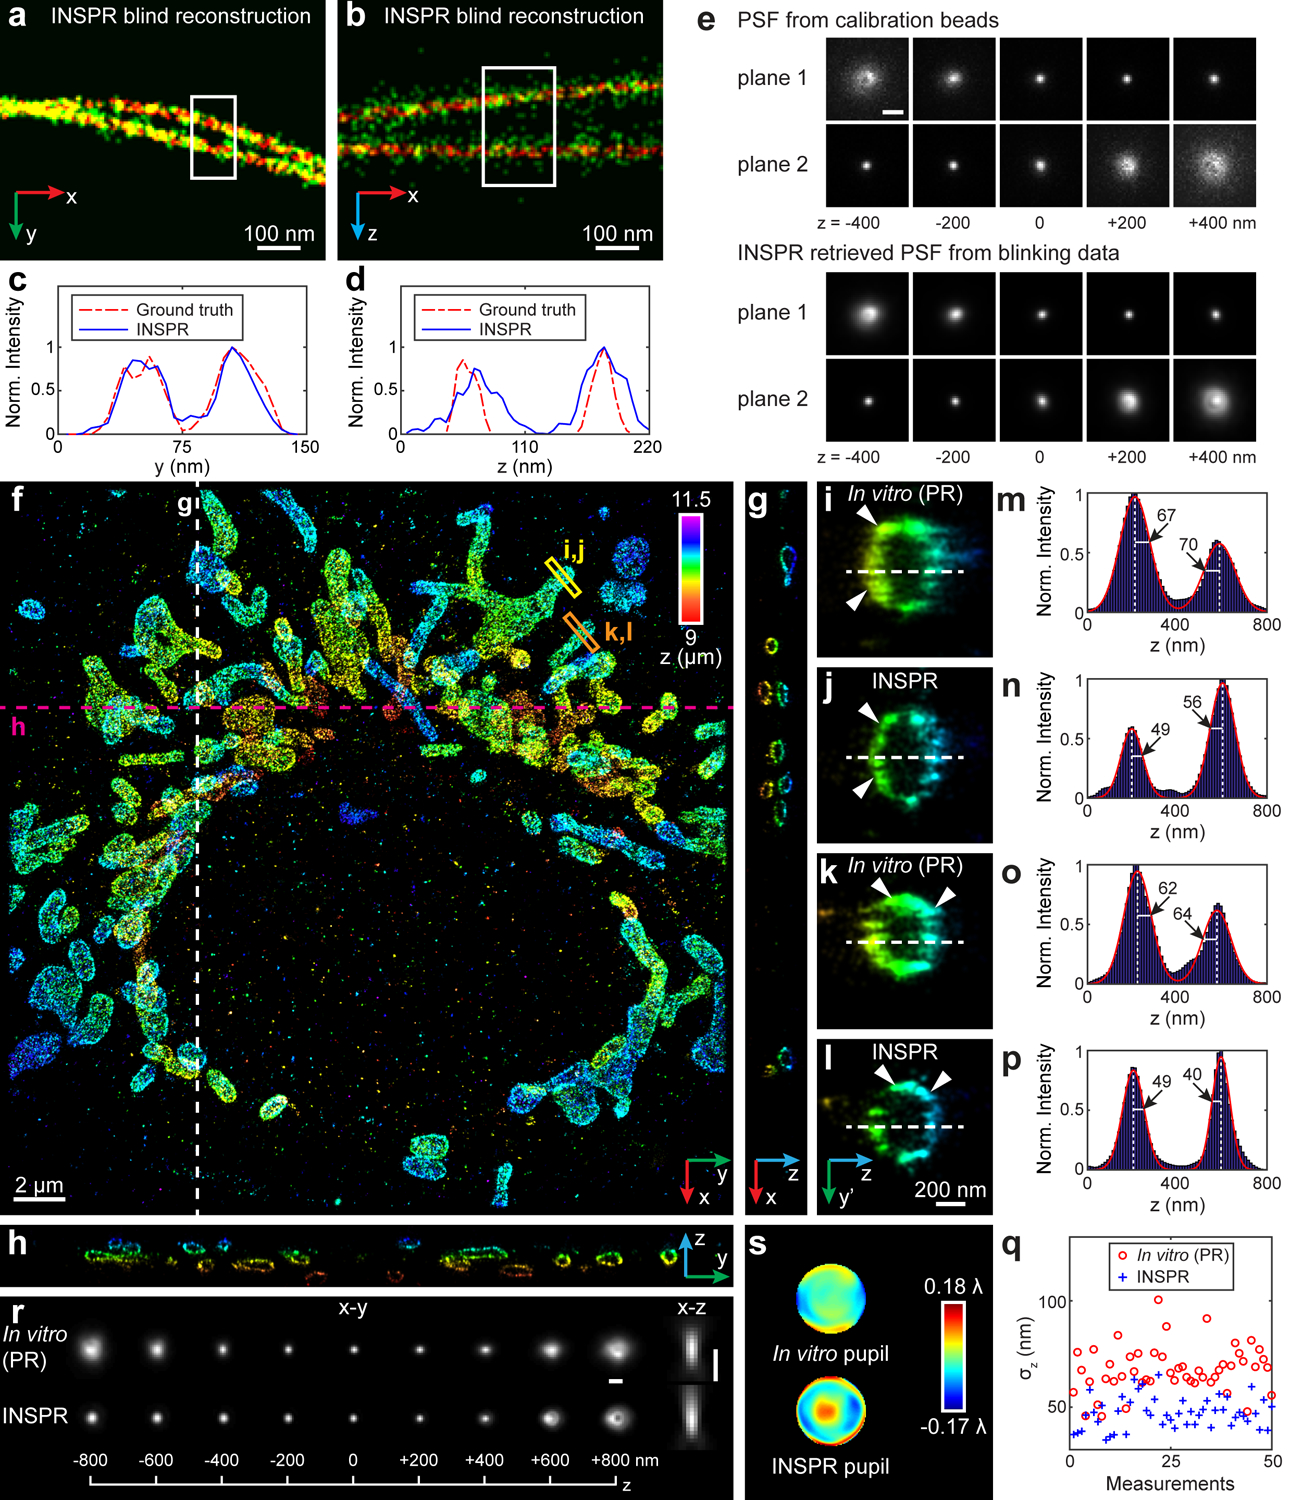
Fig. 3. Blind reconstruction of microtubules from the SMLM challenge and 3D super-resolution reconstructions of immunofluorescence-labeled TOM20 in COS-7 cells using INSPR and the in vitro approach.

(a,b) Enlarged x-y and x-z views of the blind reconstruction of microtubules from the SMLM challenge (full reconstructions are shown in Extended Data Fig. 3). (c,d) Intensity profiles of the white boxed regions in (a,b), comparing the INSPR resolved profiles (blue solid lines) with the ground truth (red dash-dot lines). (e) x-y views of the provided calibration PSF and the INSPR retrieved PSF from blinking data. Scale bar: 1 μm. (f) x-y overview of the mitochondrial network. An animated 3D reconstruction is shown in Supplementary Video 4. (g,h) x-z and y-z slices along the white and magenta dashed lines in (f). The integration width of the slices in the third dimension is 200 nm. (i–p) Enlarged y’-z views of the membrane contours reconstructed using phase retrieval based on beads attached on the coverslip (in vitro (PR), i,k) and INSPR (j,l) as indicated by the yellow and orange boxed regions in (f), and their intensity profiles along the z direction (m–p). Here the orientation of the cross section is rotated to allow projection of the 3D membrane bounded structures to the 2D image. The numbers near the black arrows in (m–p) indicate σz in nanometers. (q) Distribution of σz obtained from the intensity profiles of 25 typical outer membranes in (f) resolved by INSPR (blue plus signs) and the in vitro approach (red circles). (r,s) x-y and x-z views of the PSFs retrieved by INSPR in the deepest optical section above the bottom coverslip and the in vitro method (r), and their corresponding phase distributions (s). Scale bar in (r): 1 μm. The dataset shown is representative of two datasets of mitochondria with depths of 9 μm from the coverslip. Norm.: normalized.
