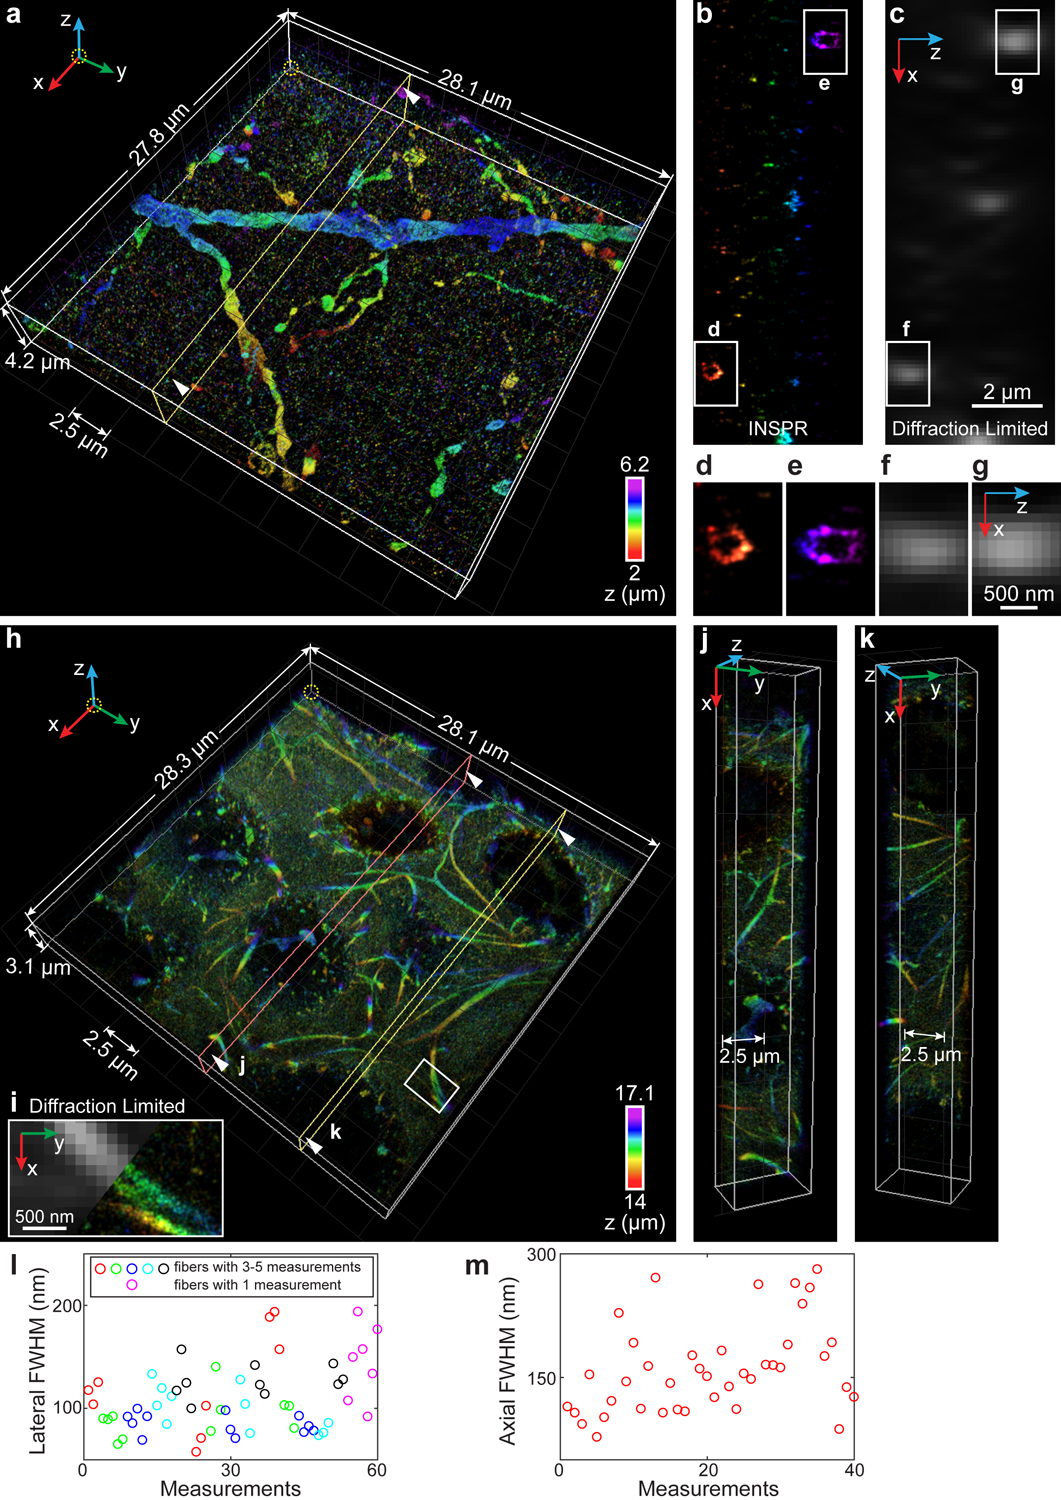
Fig. 6. 3D super-resolution reconstructions of immunofluorescence-labeled ChR2-EYFP on dendrites in visual cortical circuits and immunofluorescence-labeled elastic fibers in developing cartilage.

(a) 3D overview of a 4.2-μm-thick super-resolution volume in a 50-μm-thick brain section labeling ChR2-EYFP. An animated 3D reconstruction is shown in Supplementary Video 8. (b) Axial cross sections along the yellow plane in (a). The integration width of the x-z slice in the y direction is 200 nm. (c) Membrane bounded distributions are not resolvable in conventional diffraction-limited microscopy. (d–g) Zoomed in x-z views of the areas as indicated by the white boxed regions in (b,c). (h) 3D overview of a 3.1-μm-thick super-resolution volume in a 20-μm-thick developing cartilage tissue. An animated 3D reconstruction is shown in Supplementary Video 9. (i) Zoomed in x-y view of the area as indicated by the white boxed region in (h), showing the details of a split elastic fiber (right), which is not resolvable in conventional diffraction-limited microscopy (left). (j,k) Cross sections along the orange (j) and yellow (k) planes in (h). (l) Distribution of lateral FWHM, measured from 15 long fibers (3–5 measurements per fiber, indicated by red, green, blue, cyan, and black circles, where adjacent circles with the same color refer to multiple measurements in one fiber) and 7 short fibers (single measurement per fiber, indicated by magenta circles), both in the x-y plane. (m) Distribution of axial FWHM, measured from 40 typical elastic fibers in the x-z plane. The datasets shown are representative of five datasets of dendrites with depths of ~2 μm and two datasets of elastic fibers in developing cartilage with depths of ~14 μm.
