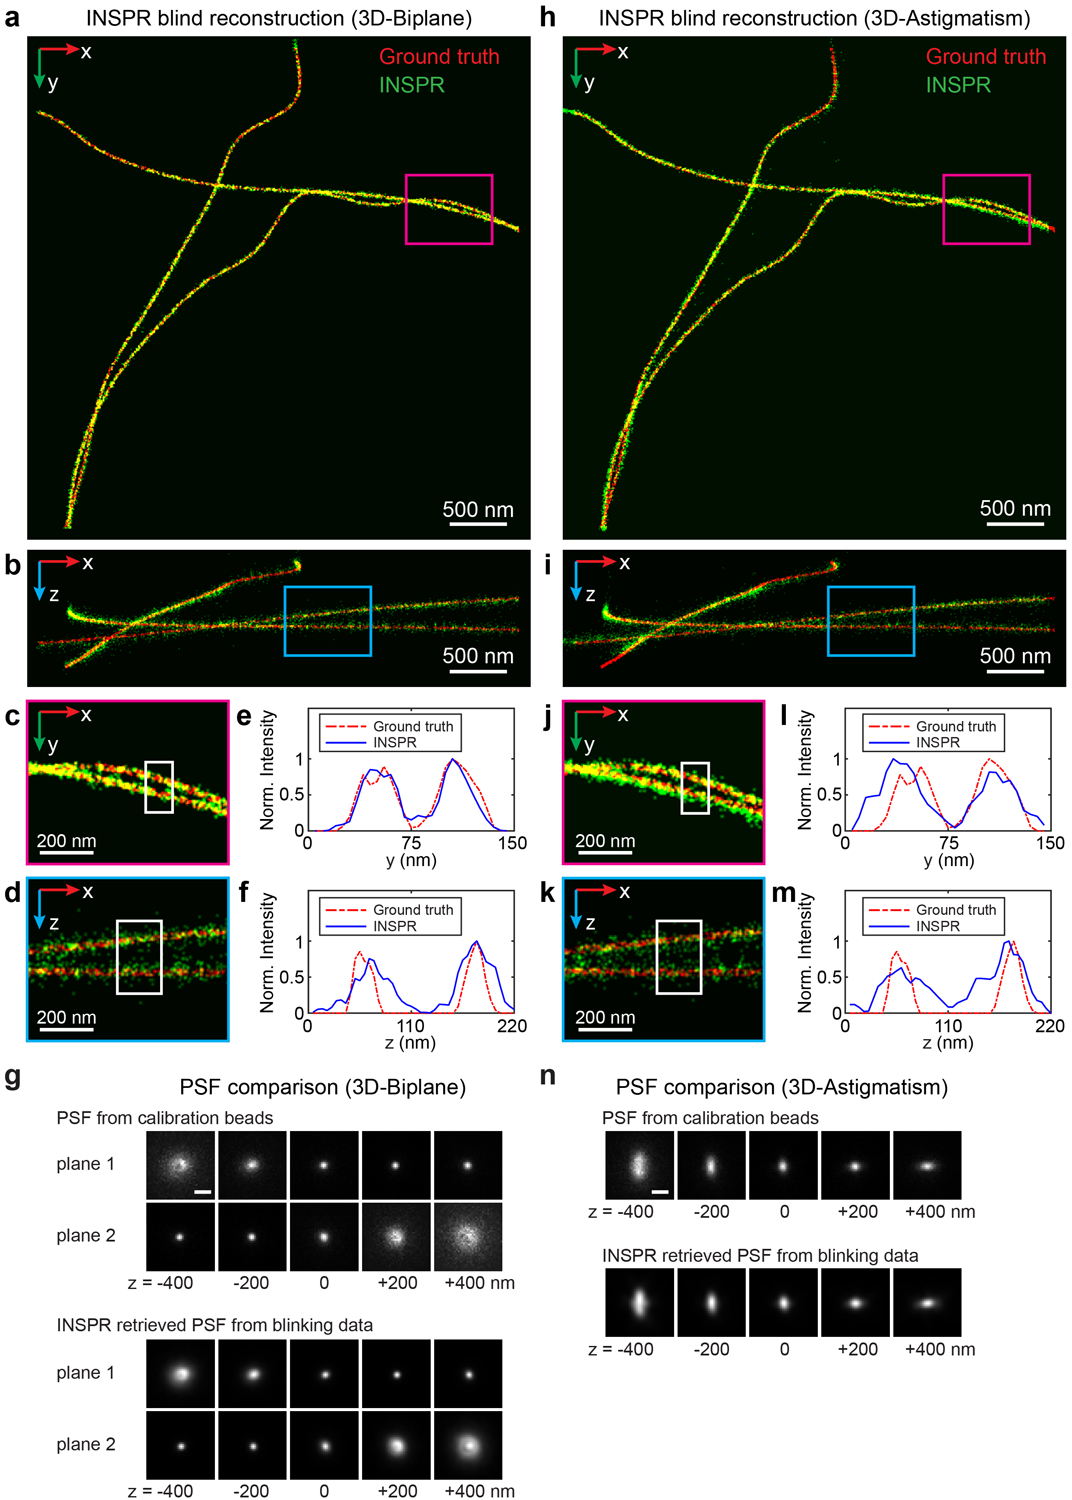
Extended Data Fig. 3. Blind reconstruction of 3D training datasets of microtubules (MT0.N1.LD) from the SMLM challenge.

(a,b) x-y and x-z overviews of the microtubules resolved by INSPR from the 3D-Biplane data. (c,d) Enlarged x-y and x-z views of the areas as indicated by the magenta and blue boxed regions in (a) and (b), respectively. (e,f) Intensity profiles along the y and z directions within the white boxed regions in (c,d), comparing the INSPR resolved profiles (blue solid lines) with the ground truth (red dash-dot lines). (g) x-y views of the provided calibration PSF (3D-Biplane, top rows) and the INSPR retrieved PSF from blinking data (bottom rows). (h,i) x-y and x-z overviews of the microtubules resolved by INSPR from the 3D-Astigmatism data. (j,k) Enlarged x-y and x-z views of the areas as indicated by the magenta and blue boxed regions in (h) and (i), respectively. (l,m) Intensity profiles along the y and z directions within the white boxed regions in (j,k), comparing the INSPR resolved profiles (blue solid lines) with the ground truth (red dash-dot lines). (n) x-y views of the provided calibration PSF (3D-Astigmatism, top rows) and the INSPR retrieved PSF from blinking data (bottom rows). Scale bar in (g,n): 1 μm. Norm.: normalized.
