
Fig. 4.
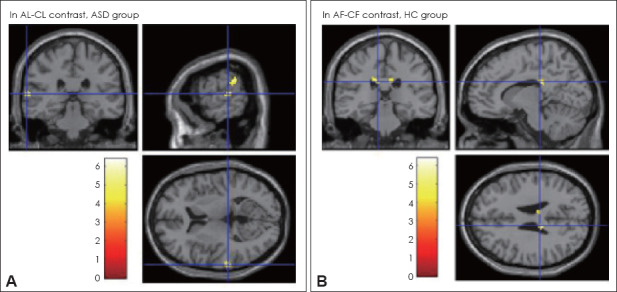
Brain regions showing significant activation with regression analysis. A: While performing “AL-CL contrast,” positive correlations were found in the ASD group between activity in various areas. The activated areas of left superior temporal gyrus and left inferior parietal lobule are seen. B: While performing “AF-CF contrast,” positive correlations were found in the HC group between activity in various areas. The activated areas of left caudate and right cingulate gyrus are seen. AF: aesthetic-fractal, AL: aesthetic-landscape, ASD: autism spectrum disorder, BA: Brodmann area, CF: control-fractal, CL: control-landscape, HC: healthy control.