
. 2018 Oct 1;29(4):161–171. doi: 10.5765/jkacap.180013
Copyright: © Journal of the Korean Academy of Child and Adolescent Psychiatry
This is an Open Access article distributed under the terms of the Creative Commons Attribution Non-Commercial License (http://creativecommons.org/licenses/by-nc/4.0) which permits unrestricted non-commercial use, distribution, and reproduction in any medium, provided the original work is properly cited.
Fig. 2.
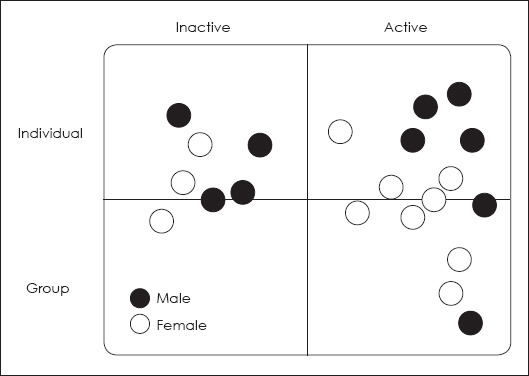
Chart of the mental health service preference of survivors (n=21).