Fig. 3.

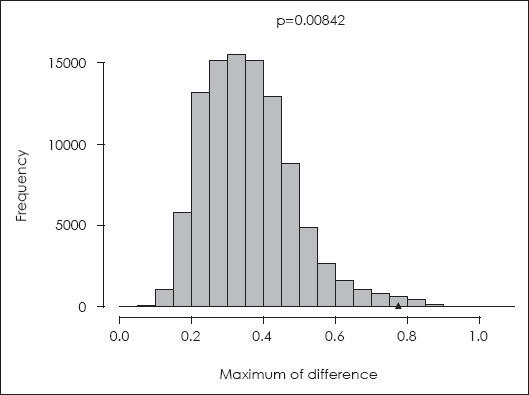
Reference distributions of test statistics based on the elementary school students for the application of the program (n=34). The triangle indicates the test statistic based on the observed data

Reference distributions of test statistics based on the elementary school students for the application of the program (n=34). The triangle indicates the test statistic based on the observed data