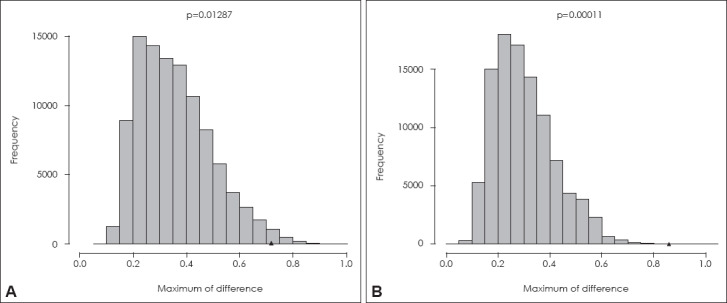
Fig. 7.

Reference distributions of test statistics based on boy and girl elementary and middle school students for the application of the program. The triangle indicates the test statistic based on the observed boy students (A: n=47) and girl students (B: n=43) data
