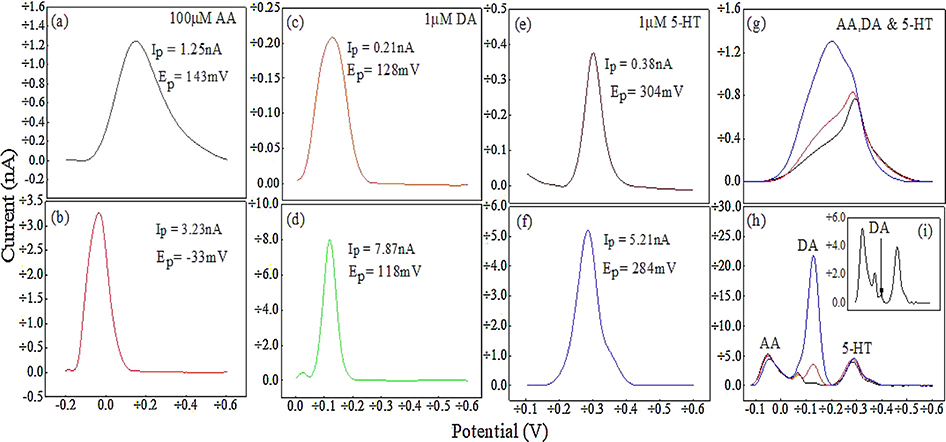
Fig. 4.
Baseline-corrected differential pulse voltammograms (DPV) of 100 μM AA, 1 μM DA and 1 μM 5-HT with unmodified (a, c, e) and MWCNT thin film modified (b, d, f) UNCD microelectrode. (g, h) DPV plots of a ternary mixture of 100 μM AA, 1 μM HT-5 and DA (100nM - black curve, inset “i”, 1 μM – red, 10 μM – blue) with unmodified and modified microelectrode, respectively. (For interpretation of the references to colour in this figure legend, the reader is referred to the web version of this article.)

