
Fig 2. APOE genotype relates to pSyn pathology and astrogliosis in A53T mice.
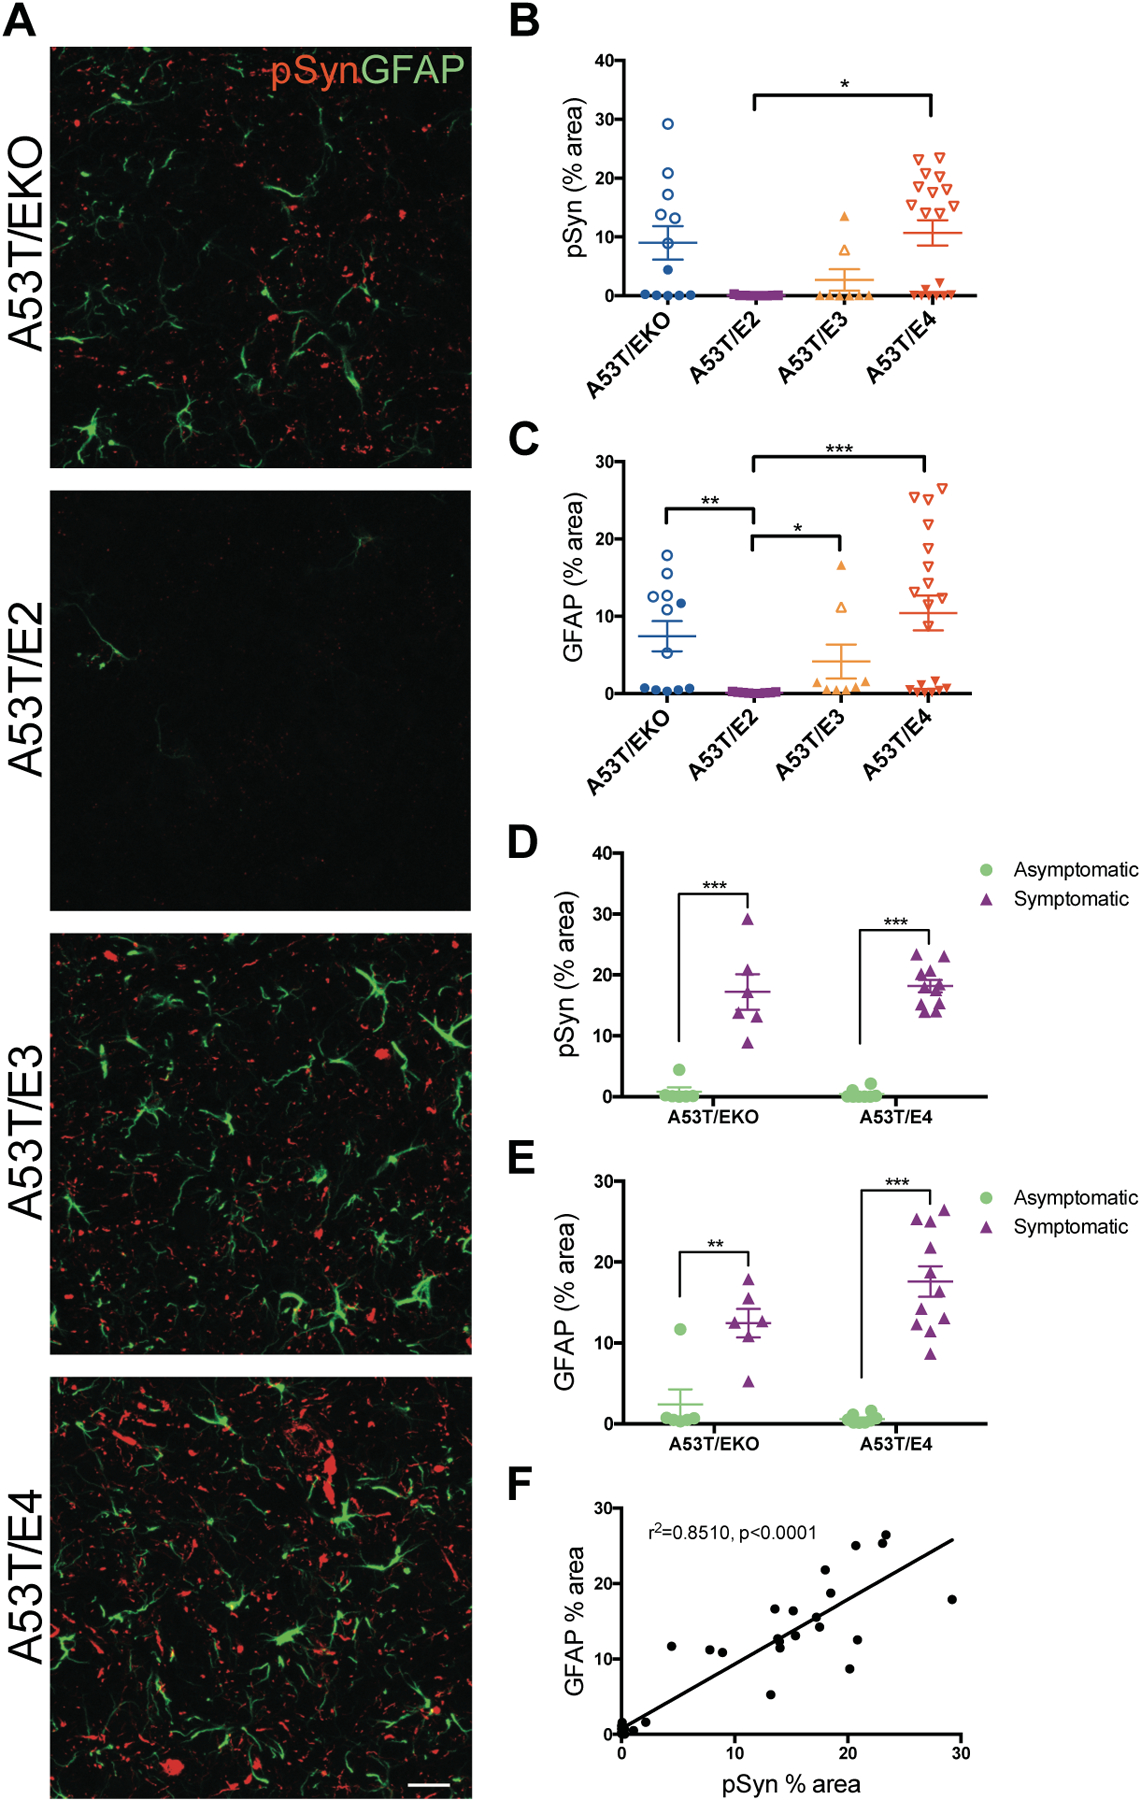
(A) Representative images showing pSyn pathology (b81A) and astrogliosis (GFAP) in the brainstem of 9–12 month old A53T mice. Images represent maximum-intensity projections of z stacks. Scale bar, 50 μm. Quantitation of the percent area covered by (B) pSyn and (C) GFAP staining in the brainstem of A53T/EKO (n=12), A53T/E2 (n=9), A53T/E3 (n=8), and A53T/E4 (n=19) mice. Closed symbols indicate asymptomatic mice; open symbols indicate symptomatic mice with endstage paralysis. Each data point represents the average of 2 adjacent regions of interest from 3 brain sections spaced 300 μm apart. Data expressed as mean ± SEM, Kruskal-Wallis test with Dunn’s multiple comparisons test. *p<0.05, **p<0.01, ***p<0.001. (D) Stratification of pSyn percent area by symptomatic vs asymptomatic status of A53T/EKO (n=12) and A53T/E4 (n=19). Data expressed as mean ± SEM, multiple t-tests, ***p<0.001. (E) Stratification of GFAP percent area by symptomatic vs asymptomatic status of A53T/EKO (n=12) and A53T/E4 (n=19). Data expressed as mean ± SEM, multiple t-tests, **p<0.01, ***p<0.001. (F) Correlation between pSyn and GFAP staining in the brainstem of A53T mice (n=12 A53T/EKO, n=9 A53T/E2, n=8 A53T/E3, n=19 A53T/E4; r2=0.8510, p<0.0001).