
Fig 3. Inflammatory gene expression in A53T mice correlates with pSyn pathology but not APOE genotype.
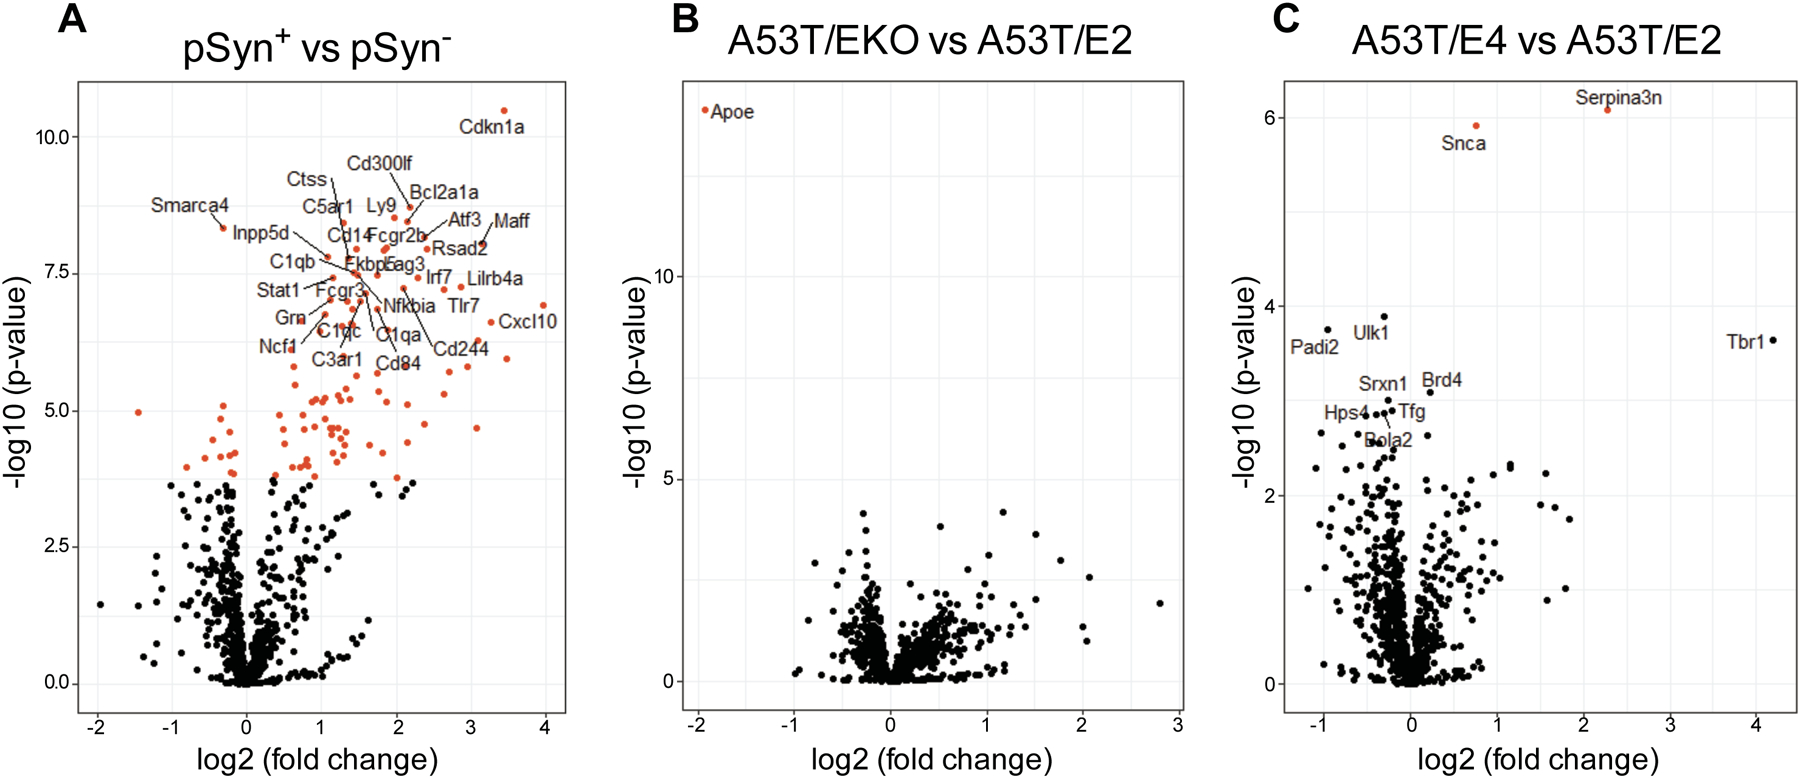
Volcano plot showing differences in gene expression in the midbrain of A53T mice stratified by (A) presence of pSyn pathology in corresponding immunohistochemical analysis, (B) EKO vs. E2 as baseline, (C) E4 vs. E2 as baseline. For each plot, significance is plotted against fold-change. Red symbols denote genes with adjusted significance of p<0.01.