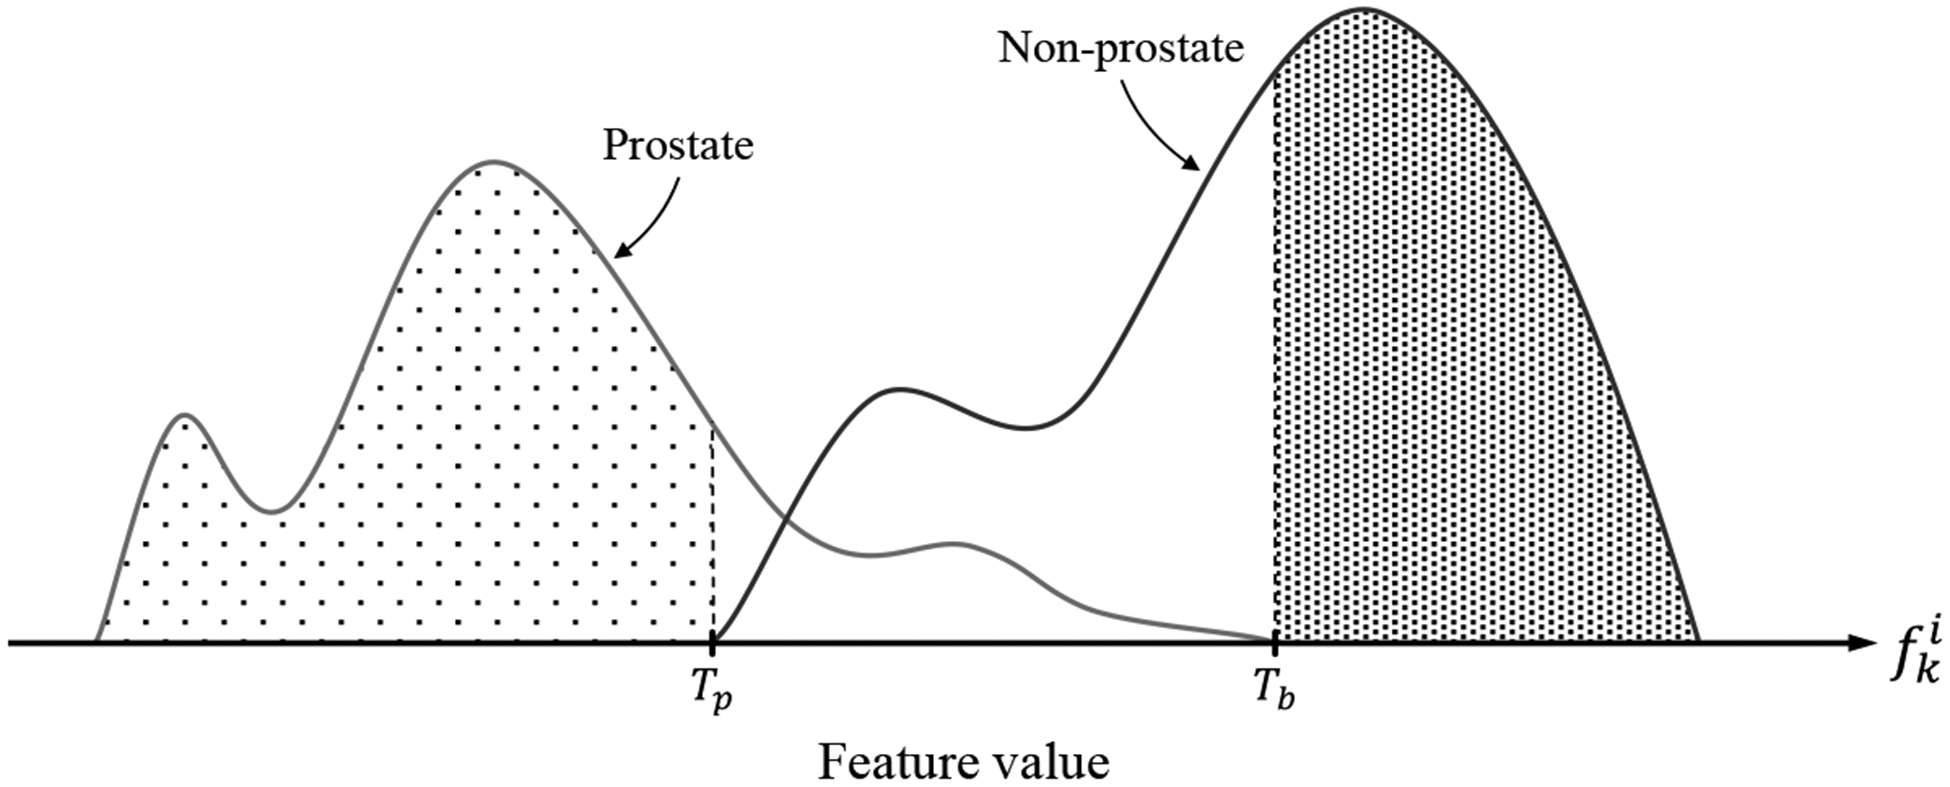
Figure 3.

Histograms of feature values extracted from prostate and non-prostate image patches. Tb is the threshold level that all of the feature values above that belong to non-prostate patches, and Tp is the threshold level that the feature values below that belong to prostate patches. The feature values between Tb and Tp belong to either prostate or non-prostate patches.
