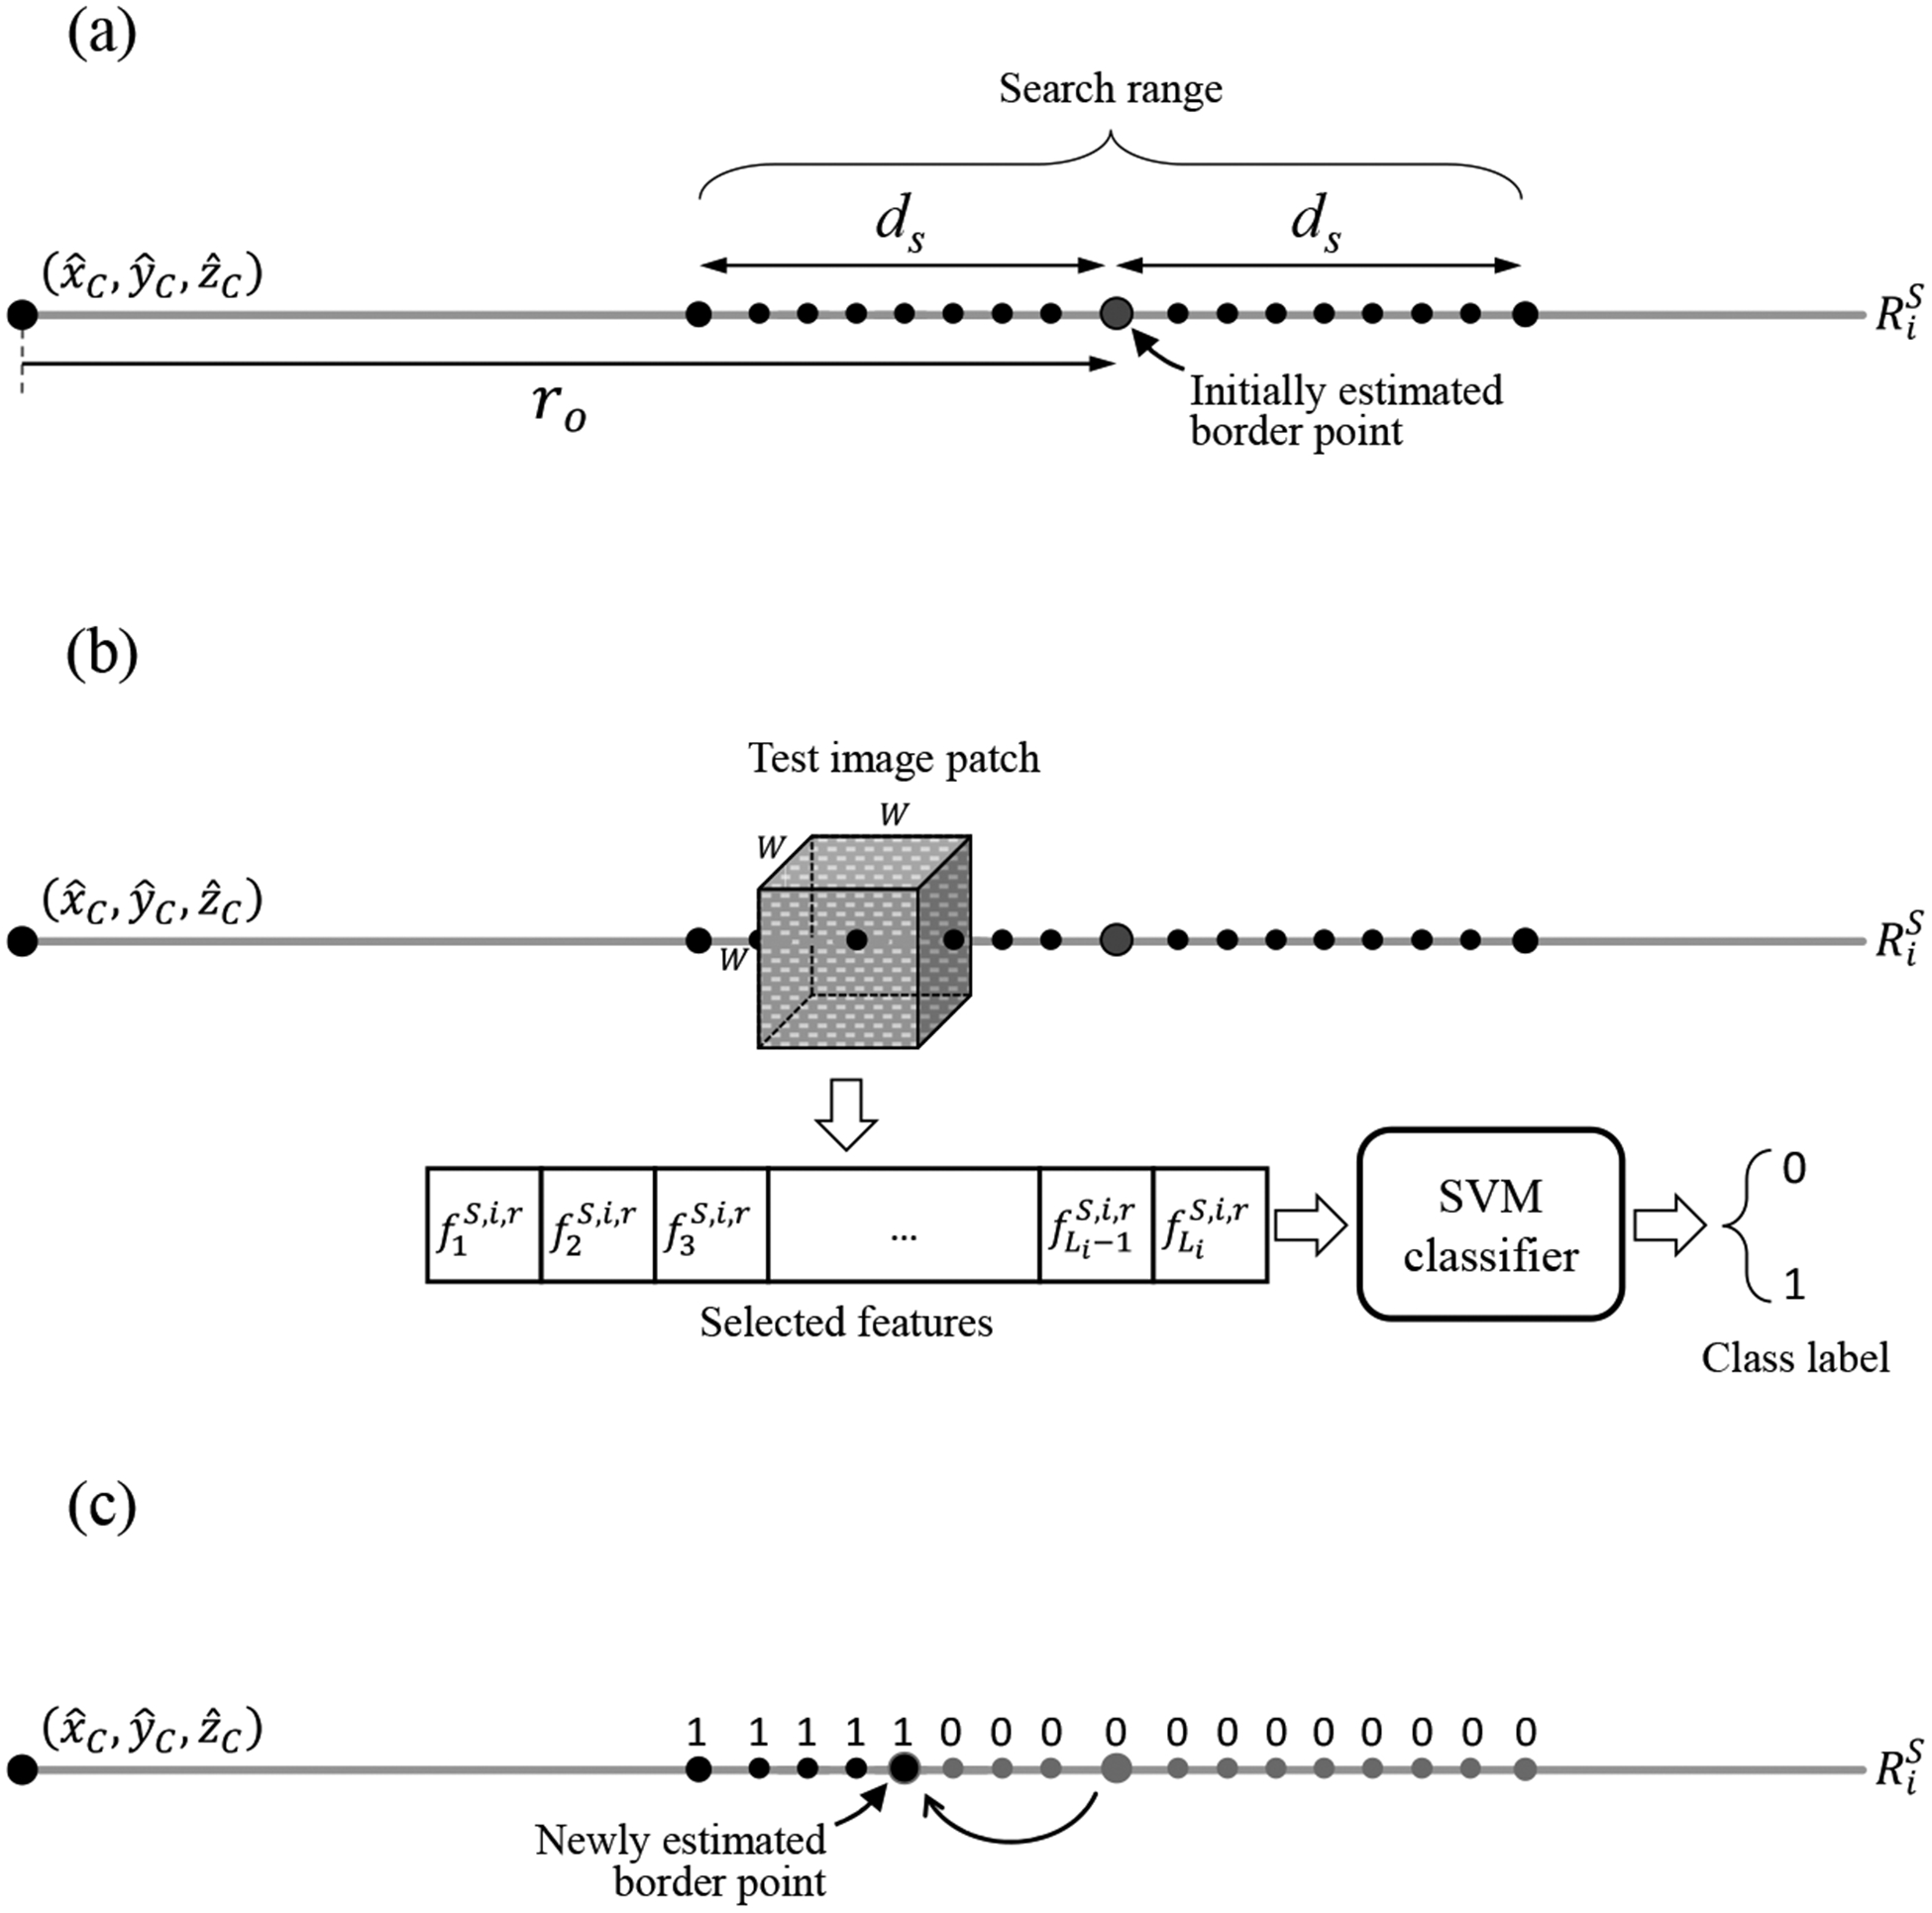
Figure 4.

Local classification process. (a) Selected search points on a sample test ray . is the estimated prostate center point. (b) A sample cubic image patch centered at one of the ray points within the defined search range. The patch is classified based on an extracted vector of texture features containing the features selected for the test ray during training. (c) A new border point is estimated after classification of all the search points.
