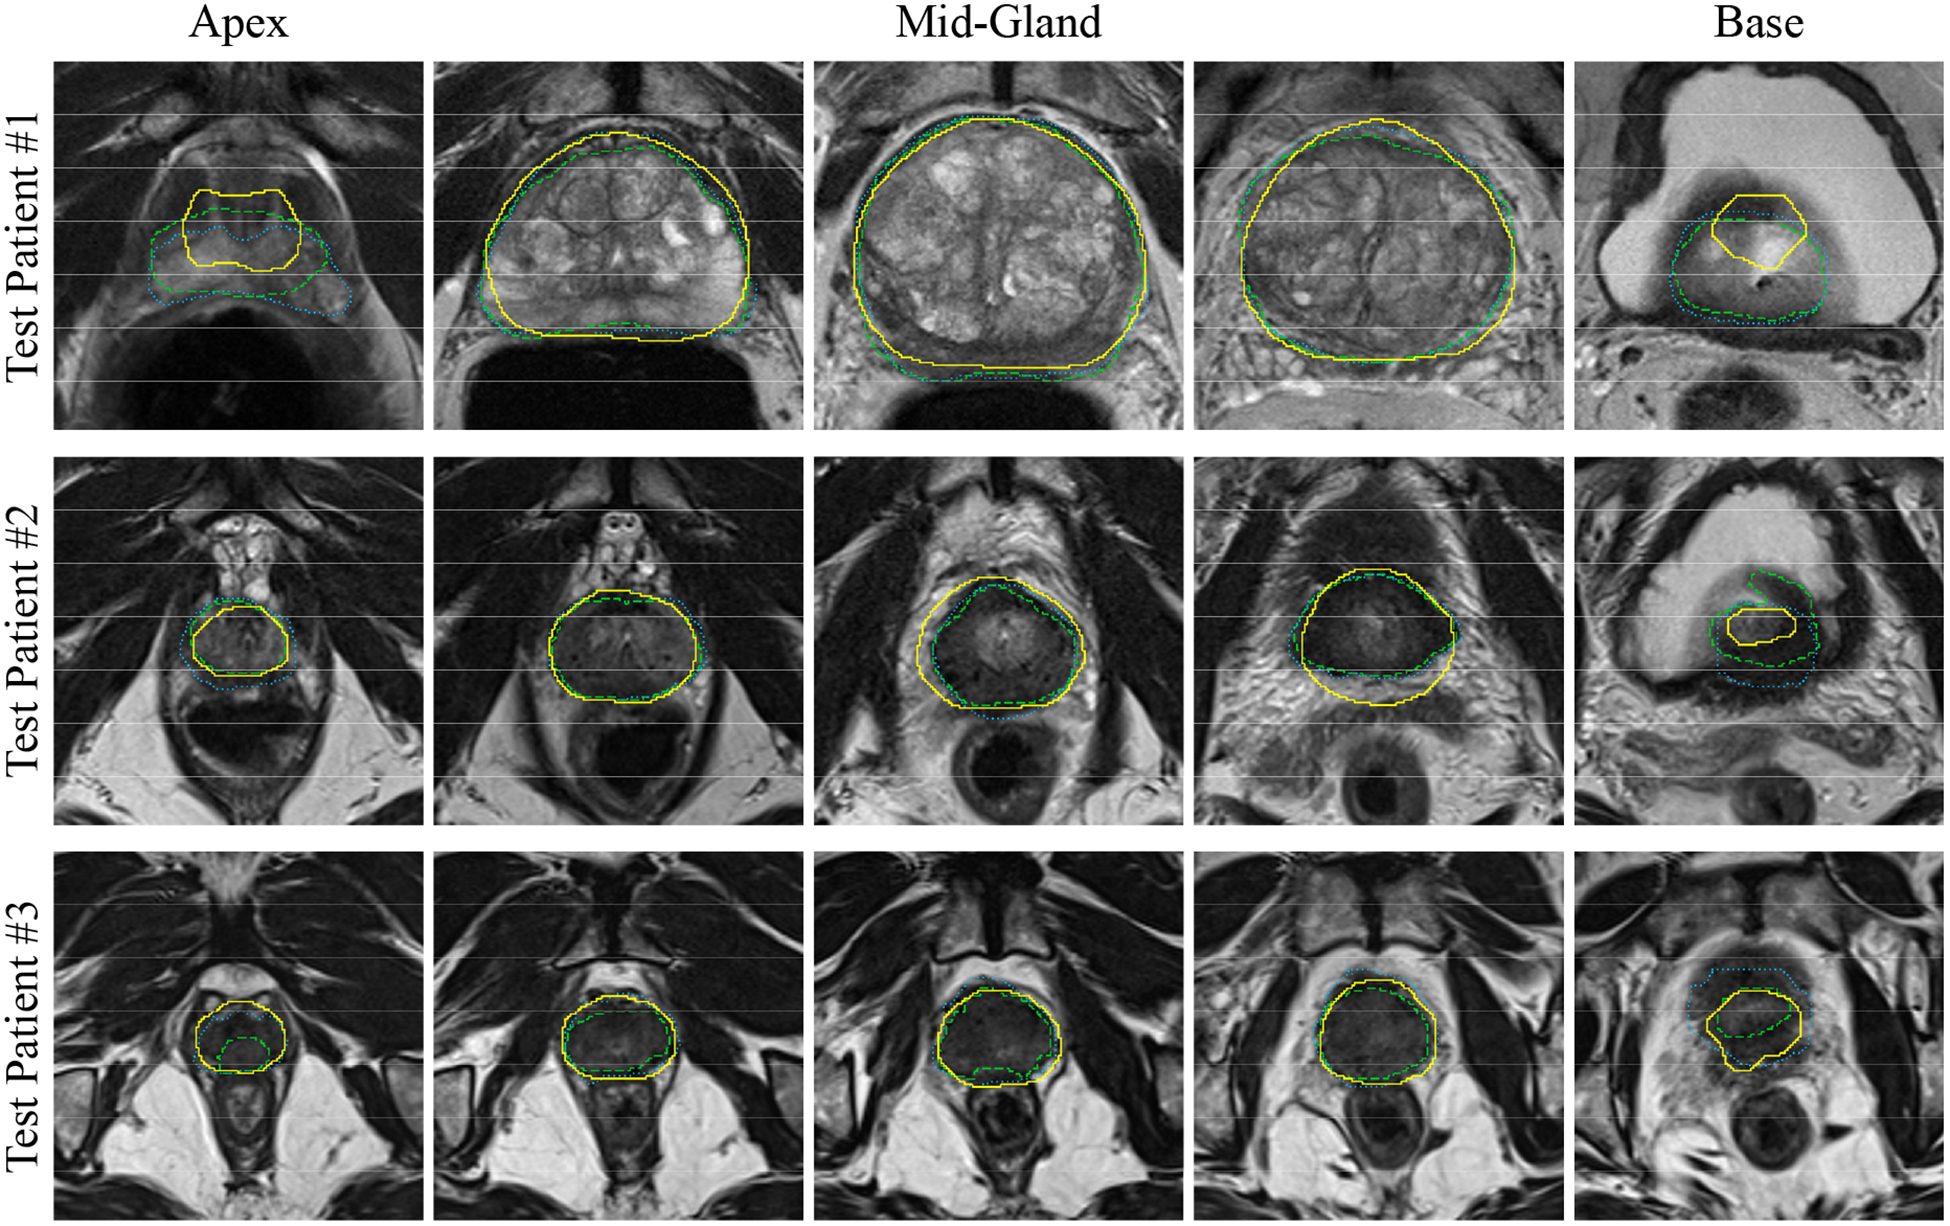
Figure 5.

Qualitative segmentation results on five, 2D axial slices for three sample prostates. Each row shows the results for one patient. For each case, the left image is the inferior-most (apex) slices, and the right image is the superior-most (base) slice. The algorithm segmentation is shown with solid yellow contours; reference #1 is shown with dotted, blue contours; and the reference #2 is shown with dashed, green contours.
