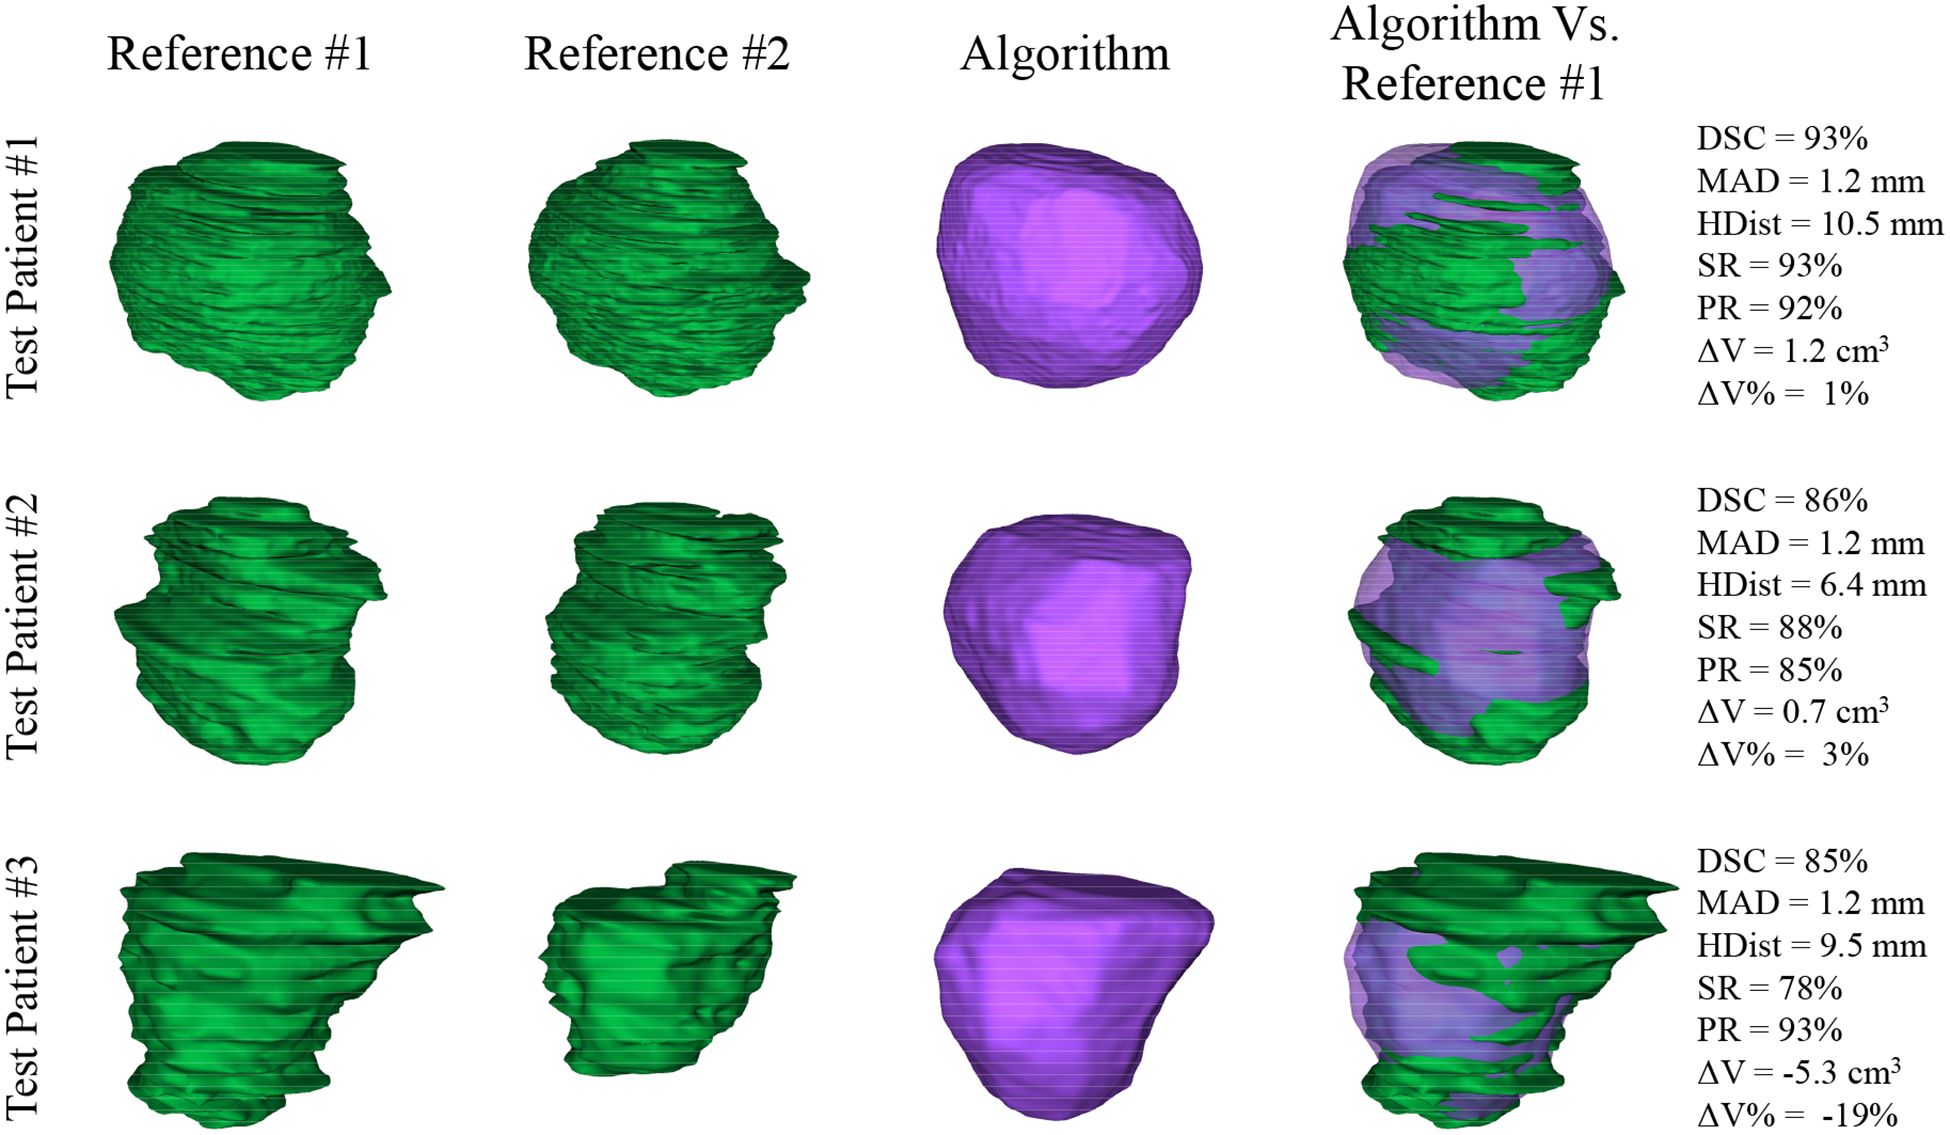
Figure 6.

Qualitative and quantitative segmentation results in 3D for the three, sample prostates shown in Figure 5. First two left columns show the manual segmentations by two radiologists in green, the third column shows the algorithm segmentation results in purple, and the fifth column compares the algorithm segmentation against the reference #1 (first column) along with the error metric values mentioned on the right.
